SkyWest Airlines 2005 Annual Report Download - page 56
Download and view the complete annual report
Please find page 56 of the 2005 SkyWest Airlines annual report below. You can navigate through the pages in the report by either clicking on the pages listed below, or by using the keyword search tool below to find specific information within the annual report.-
 1
1 -
2
-
3
-
4
-
5
-
6
-
7
-
8
-
9
-
10
-
11
-
12
-
13
-
14
-
15
-
16
-
17
-
18
-
19
-
20
-
21
-
22
-
23
-
24
-
25
-
26
-
27
-
28
-
29
-
30
-
31
-
32
-
33
-
34
-
35
-
36
-
37
-
38
-
39
-
40
-
41
-
42
-
43
-
44
-
45
-
 46
46 -
 47
47 -
 48
48 -
 49
49 -
 50
50 -
 51
51 -
 52
52 -
 53
53 -
 54
54 -
 55
55 -
 56
56 -
 57
57 -
 58
58 -
 59
59 -
 60
60 -
 61
61 -
 62
62 -
 63
63 -
 64
64 -
 65
65 -
 66
66 -
67
-
68
-
69
-
70
-
71
-
72
-
73
-
74
-
75
-
76
-
77
-
78
-
79
-
80
-
81
-
82
-
83
-
84
 |
 |

52
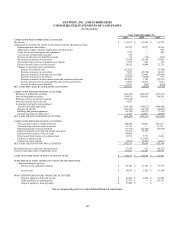
The calculation of the weighted average number of common shares outstanding for Basic EPS and Diluted EPS are as follows
for the years ended December 31, 2005, 2004 and 2003 (in thousands):
Year Ended December 31,
2005 2004 2003
Numerator:
Numerator for earnings per share $ 112,267 $ 81,952 $ 66,787
Denominator:
Denominator for basic earnings per-share
weighted average shares 57,851 57,858 57,745
Dilution due to stock options 1,082 492 382
Denominator for diluted earnings per-share
weighted average shares 58,933 58,350 58,127
Basic earnings per-share $ 1.94 $ 1.42 $ 1.16
Diluted earnings per -share $ 1.90 $ 1.40 $ 1.15
Stock Options
The Company applies Accounting Principles Board Opinion No. 25 and related interpretations in accounting for its stock-
based compensation plans. Statement of Financial Accounting Standards (“SFAS”) No. 123, Accounting for Stock-Based
Compensation, requires pro forma information regarding net income and net income per share as if the Company had accounted
for its stock options under the fair value method of the statement which is described more fully in Note 5 below. The Company
did not record any stock-based compensation expense related to stock options for the years ended December 31, 2005, 2004 and
2003.
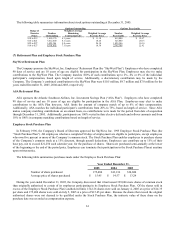
The following table contains the pro forma disclosures and the related impact on net income and net income per share (in
thousands, except per share information):
Year Ended December 31,
2005 2004 2003
Net income:
As reported $ 112,267 $ 81,952 $ 66,787
Stock based compensation under
fair value method (4,927) (6,706
)
(7,679)
Pro forma $ 107,340 $ 75,246 $ 59,108
Net income per common share:
Basic as reported $ 1.94 $ 1.42 $ 1.16
Basic pro forma $ 1.86 $ 1.30 $ 1.02
Diluted as reported $ 1.90 $ 1.40 $ 1.15
Diluted pro forma $ 1.82 $ 1.29 $ 1.02
Comprehensive Income
The Company reports comprehensive income in accordance with SFAS No. 130, Reporting Comprehensive Income, which
establishes standards for reporting and displaying comprehensive income and its components in financial statements.
Comprehensive income includes charges and credits to stockholders’ equity that are not the result of transactions with
shareholders. As of December 31, 2005 and 2004, accumulated other comprehensive loss includes adjustments, net of tax, to
reflect unrealized appreciation (depreciation) on marketable securities. The Company recorded net unrealized appreciation
(depreciation) of $(347,000), $(910,000), and $1,273,000, net of income taxes, on marketable securities for the years ended