SkyWest Airlines 2005 Annual Report Download - page 52
Download and view the complete annual report
Please find page 52 of the 2005 SkyWest Airlines annual report below. You can navigate through the pages in the report by either clicking on the pages listed below, or by using the keyword search tool below to find specific information within the annual report.-
 1
1 -
2
-
3
-
4
-
5
-
6
-
7
-
8
-
9
-
10
-
11
-
12
-
13
-
14
-
15
-
16
-
17
-
18
-
19
-
20
-
21
-
22
-
23
-
24
-
25
-
26
-
27
-
28
-
29
-
30
-
31
-
32
-
33
-
34
-
35
-
36
-
37
-
38
-
39
-
40
-
41
-
 42
42 -
 43
43 -
 44
44 -
 45
45 -
 46
46 -
 47
47 -
 48
48 -
 49
49 -
 50
50 -
 51
51 -
 52
52 -
 53
53 -
 54
54 -
 55
55 -
 56
56 -
 57
57 -
 58
58 -
 59
59 -
 60
60 -
 61
61 -
 62
62 -
63
-
64
-
65
-
66
-
67
-
68
-
69
-
70
-
71
-
72
-
73
-
74
-
75
-
76
-
77
-
78
-
79
-
80
-
81
-
82
-
83
-
84
 |
 |

48
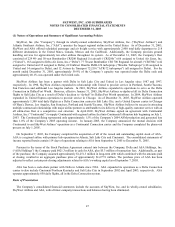
Use of Estimates
The preparation of financial statements in conformity with accounting principals generally accepted in the United States of
America requires management to make estimates and assumptions that affect the reported amounts of assets and liabilities and
disclosure of contingent assets and liabilities at the date of the financial statements and the reported amounts of revenues and
expenses during the reporting period. Actual results could differ from those estimates.
Cash and Cash Equivalents
The Company considers all highly liquid investments with an original maturity of three months or less to be cash equivalents.
The Company classified $24.8 and $9.2 million of cash as restricted cash as required by the Company’s workers’ compensation
policy, purchase of ASA and classified it accordingly in the consolidated balance sheets as of December 31, 2005 and 2004,
respectively.
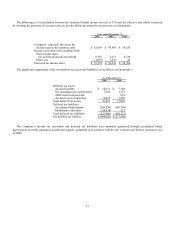
Marketable Securities
The Company’s investments in marketable debt and equity securities are deemed by management to be available for sale and
are reported at fair market value with the net unrealized appreciation or depreciation reported as a component of accumulated
other comprehensive income (loss) in stockholders’ equity. At the time of sale, any realized appreciation or depreciation,
calculated by the specific identification method, is recognized in gain(loss) on sale of marketable securities. The Company’s
position in marketable securities as of December 31, 2005 and 2004 was as follows (in thousands):
2005
2004
Investment Types Cost Market Value Cost Market Value
Commercial paper $ — $ — $ 13,016 $ 13,019
Bond and bond funds 155,192 152,929 276,995 275,292
Corporate notes — — 121,926 121,913
Asset backed securities 6,167 6,125 17,283 17,226
Other — — 62 67
161,359 159,054 429,282 427,517
Unrealized depreciation (2,305) — (1,765) —
Total $ 159,054 $ 159,054 $ 427,517 $ 427,517
Marketable securities had the following maturities as of December 31, 2005 (in thousands):
Maturities
Amount
Year 2006 $ 112,616
Years 2007 through 2010 3,963
Years 2011 through 2015 2,277
Thereafter 40,198
The Company has classified all marketable securities as short-term since it has the intent to maintain a liquid portfolio and the
ability to redeem the securities within one year.
Inventories
Inventories include expendable parts, fuel and supplies and are valued at cost (FIFO basis) less an allowance for obsolescence
based on historical results and management’s expectations of future operations. Expendable inventory parts are charged to
expense as used. An allowance for obsolescence is provided for spare parts currently identified as excess to reduce the carrying
costs to net realizable value. These allowances are based on management estimates, which are subject to change.