SkyWest Airlines 2005 Annual Report Download - page 31
Download and view the complete annual report
Please find page 31 of the 2005 SkyWest Airlines annual report below. You can navigate through the pages in the report by either clicking on the pages listed below, or by using the keyword search tool below to find specific information within the annual report.-
 1
1 -
2
-
3
-
4
-
5
-
6
-
7
-
8
-
9
-
10
-
11
-
12
-
13
-
14
-
15
-
16
-
17
-
18
-
19
-
20
-
 21
21 -
 22
22 -
 23
23 -
 24
24 -
 25
25 -
 26
26 -
 27
27 -
 28
28 -
 29
29 -
 30
30 -
 31
31 -
 32
32 -
 33
33 -
 34
34 -
 35
35 -
 36
36 -
 37
37 -
 38
38 -
 39
39 -
 40
40 -
 41
41 -
42
-
43
-
44
-
45
-
46
-
47
-
48
-
49
-
50
-
51
-
52
-
53
-
54
-
55
-
56
-
57
-
58
-
59
-
60
-
61
-
62
-
63
-
64
-
65
-
66
-
67
-
68
-
69
-
70
-
71
-
72
-
73
-
74
-
75
-
76
-
77
-
78
-
79
-
80
-
81
-
82
-
83
-
84
 |
 |

27
Of the shares sold in excess of the Employee Stock Purchase Plan’s authorized limit, 154,126 shares were sold on January 4,
2005 at a price of $14.35 per share and 175,480 shares were sold on July 5, 2005 at a price of $15.45 per share. Pursuant to the
provisions of the Employee Stock Purchase Plan, the amounts paid by the participating employees for the shares were withheld as
payroll deductions from compensation we would have otherwise paid to such employees during the six-month period preceding
the month of each sale.
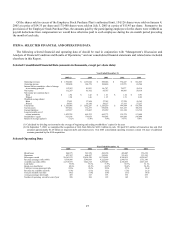
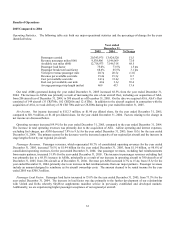
ITEM 6. SELECTED FINANCIAL AND OPERATING DATA
The following selected financial and operating data of should be read in conjunction with “Management’s Discussion and
Analysis of Financial Condition and Results of Operations,” and our consolidated financial statements and related notes included
elsewhere in this Report.
Selected Consolidated Financial Data (amounts in thousands, except per share data):
Year Ended December 31,
2005(2) 2004 2003 2002 2001
Operating revenues $ 1,964,048 $ 1,156,044 $ 888,026 $ 774,447 $ 601,865
Operating income 220,408 144,776 108,480 119,555 65,564
Income before cumulative effect of change
in accounting principle 112,267 81,952 66,787 78,277 50,516
Net income 112,267 81,952 66,787 86,866 50,516
Net income per common share:
Basic $ 1.94 $ 1.42 $ 1.16 $ 1.52 $ 0.90
Diluted 1.90 1.40 1.15 1.51 0.88
Weighted average shares:
Basic 57,851 57,858 57,745 57,229 56,365
Diluted 58,933 58,350 58,127 57,551 57,237
Total assets $ 3,320,646 $ 1,662,287 $ 1,529,210 $ 999,384 $ 831,566
Current assets 693,632 712,337 670,368 513,233 386,556
Current liabilities 615,917 170,467 151,959 121,388 115,738
Long-term debt, net of
current maturities 1,422,758 463,233 462,773 125,379 113,688
Stockholders’ equity 913,198 779,055 709,063 638,686 545,840
Return on average equity(1) 13.2% 11.0% 9.9% 14.7% 9.8%
(1) Calculated by dividing net income by the average of beginning and ending stockholders’ equity for the year
(2) On September 7, 2005, we completed the acquisition of ASA from Delta for $421.3 million in cash. We paid $5.3 million of transaction fees and ASA
assumed approximately $1.25 billion in long-term debt and related assets. Our 2005 consolidated operating revenues contain 114 days of additional
revenue generated by the ASA acquisition.
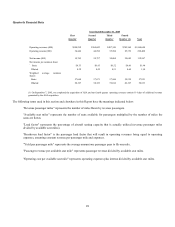
Selected Operating Data
Year Ended December 31,
2005 2004 2003 2002 2001
Block hours 866,975 589,129 482,158 405,007 356,370
Departures 623,307 464,697 395,631 351,631 333,383
Passengers carried 20,343,975 13,424,520 10,738,691 8,388,935 6,229,867
Revenue passenger miles (000) 9,538,906 5,546,069 4,222,669 2,990,753 1,732,180
Available seat miles (000) 12,718,973 7,546,318 5,875,029 4,356,053 2,837,278
Load factor 75.0% 73.5% 71.9% 68.7% 61.1%
Break-even load factor 68.6% 65.5% 63.9% 58.4% 54.4%
Yield per revenue passenger mile 20.3¢ 20.5¢ 20.9¢ 25.7¢ 34.4¢
Revenue per available seat mile 15.4¢ 15.3¢ 15.1¢ 17.8¢ 21.2¢
Cost per available seat mile 14.1¢ 13.6¢ 13.4¢ 15.1¢ 18.9¢
Average passenger trip length 469 413 393 356 278
Number of operating aircraft at end of year 380 206 185 149 131