SkyWest Airlines 2005 Annual Report Download - page 38
Download and view the complete annual report
Please find page 38 of the 2005 SkyWest Airlines annual report below. You can navigate through the pages in the report by either clicking on the pages listed below, or by using the keyword search tool below to find specific information within the annual report.-
 1
1 -
2
-
3
-
4
-
5
-
6
-
7
-
8
-
9
-
10
-
11
-
12
-
13
-
14
-
15
-
16
-
17
-
18
-
19
-
20
-
21
-
22
-
23
-
24
-
25
-
26
-
27
-
 28
28 -
 29
29 -
 30
30 -
 31
31 -
 32
32 -
 33
33 -
 34
34 -
 35
35 -
 36
36 -
 37
37 -
 38
38 -
 39
39 -
 40
40 -
 41
41 -
 42
42 -
 43
43 -
 44
44 -
 45
45 -
 46
46 -
 47
47 -
 48
48 -
49
-
50
-
51
-
52
-
53
-
54
-
55
-
56
-
57
-
58
-
59
-
60
-
61
-
62
-
63
-
64
-
65
-
66
-
67
-
68
-
69
-
70
-
71
-
72
-
73
-
74
-
75
-
76
-
77
-
78
-
79
-
80
-
81
-
82
-
83
-
84
 |
 |

34
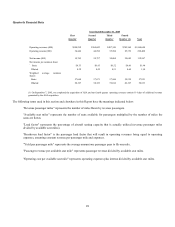
wages and employee benefits associated with our maintenance operations (those costs are stated separately in the table), the
maintenance expense line in the above table differs from the maintenance line in our Condensed Consolidated Statements of
Income set forth in Item 8 below.
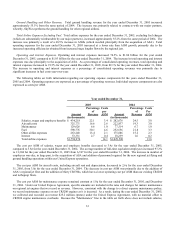
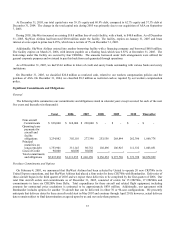
The cost per ASM for fuel increased 39.4% to 4.6¢ for the year ended December 31, 2005, from 3.3¢ for the year ended
December 31, 2004. This increase was primarily due to the average price of fuel increasing to $2.05 per gallon during the year
ended December 31, 2005, from $1.45 per gallon for the year ended December 31, 2004.
The cost per ASM for other expenses, primarily consisting of landing fees, station rentals, computer reservation system fees
and hull and liability insurance, decreased 8.7% to 2.1¢ for the year ended December 31, 2005, from 2.3¢ for the year ended
December 31, 2004. The decrease was primarily related to the increase in stage lengths flown by our regional jets.
Interest expense increased to approximately $53.3 million during the year ended December 31, 2005, from approximately
$18.2 million during the year ended December 31, 2004. The increase in interest expense was primarily due to the acquisition of
ASA’s aircraft which are primarily financed with long-term debt.
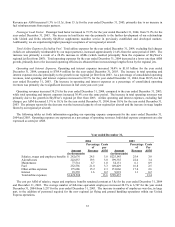
2004 Compared to 2003
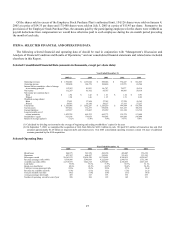
Operating Statistics. The following table sets forth our major operational statistics and the percentage-of-change for the years
identified below.
Year ended
December 31,
2004 2003 %Change
Passengers carried 13,424,520 10,738,691 25.0
Revenue passenger miles (000) 5,546,069 4,222,669 31.3
Available seat miles (000) 7,546,318 5,875,029 28.4
Passenger load factor 73.5% 71.9% 1.6 pts
Passenger breakeven load factor 65.5% 63.9% 1.6 pts
Yield per revenue passenger mile 20.50¢ 20.90¢ (1.9)
Revenue per available seat mile 15.30¢ 15.10¢ 1.3
Cost per available seat mile 13.60¢ 13.40¢ 1.5
Fuel cost per available seat mile 3.30¢ 2.50¢ 32.0
Average passenger trip length (miles) 413 393 5.1
The total ASMs we generated during the year ended December 31, 2004 increased 28.4% from the year ended December 31,
2003. The increase in ASMs was primarily a result of the increase in our operating aircraft to 206 aircraft as of December 31,
2004, from 185 aircraft as of December 31, 2003. During the year ended December 31, 2004, we took delivery of 12 new
CRJ200s, four used CRJ200s with an average age of less than one year and 12 new CRJ700s.
Net Income. Net income increased to $81.9 million, or $1.40 per diluted share, for the year ended December 31, 2004,
compared to $66.8 million, or $1.15 per diluted share, for the year ended December 31, 2003. Factors relating to the change in
net income are discussed below.
Passenger Revenues. Passenger revenues include an amount designed to reimburse us for aircraft ownership cost. The
amount deemed to be rental income for the year ended 2004 was $187.0 million. Passenger revenues, which represented 98.6%
of consolidated operating revenues for the year ended December 31, 2004, increased 29.2% to $1.14 billion for the year ended
December 31, 2004, from $882.1 million, or 99.3% of consolidated operating revenues, for the year ended December 31, 2003.
Passenger revenues, excluding fuel reimbursements from major partners, increased 21.1% for the year ended December 31, 2004.
The increase in passenger revenues excluding fuel was primarily due to a 28.4% increase in ASMs, principally as a result of us
increasing our operating aircraft to 206 aircraft as of December 31, 2004, from 185 aircraft as of December 31, 2003; however,
this increase was partially offset by the economic efficiencies of flying new, incremental regional jet aircraft. These efficiencies
are passed on to our major partners through the rates contemplated by their respective contracts. Twelve CRJ700s and twelve
additional CRJ200s were placed into service under our United Express operations during the year ended December 31, 2004.