SkyWest Airlines 2005 Annual Report Download - page 32
Download and view the complete annual report
Please find page 32 of the 2005 SkyWest Airlines annual report below. You can navigate through the pages in the report by either clicking on the pages listed below, or by using the keyword search tool below to find specific information within the annual report.-
 1
1 -
2
-
3
-
4
-
5
-
6
-
7
-
8
-
9
-
10
-
11
-
12
-
13
-
14
-
15
-
16
-
17
-
18
-
19
-
20
-
21
-
 22
22 -
 23
23 -
 24
24 -
 25
25 -
 26
26 -
 27
27 -
 28
28 -
 29
29 -
 30
30 -
 31
31 -
 32
32 -
 33
33 -
 34
34 -
 35
35 -
 36
36 -
 37
37 -
 38
38 -
 39
39 -
 40
40 -
 41
41 -
 42
42 -
43
-
44
-
45
-
46
-
47
-
48
-
49
-
50
-
51
-
52
-
53
-
54
-
55
-
56
-
57
-
58
-
59
-
60
-
61
-
62
-
63
-
64
-
65
-
66
-
67
-
68
-
69
-
70
-
71
-
72
-
73
-
74
-
75
-
76
-
77
-
78
-
79
-
80
-
81
-
82
-
83
-
84
 |
 |

28
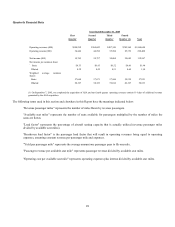
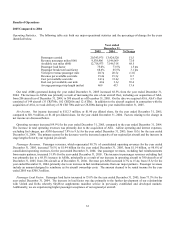
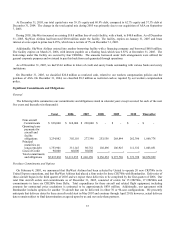
Quarterly Financial Data
Year Ended December 31, 2005
First Second Third Fourth
Quarter Quarter Quarter Quarter (1) Year
Operating revenues (000) $340,292 $384,043 $497,349 $742,364 $1,964,048
Operating income (000) 34,446 44,596 55,994 85,372 220,408
Net income (000) 18,765 24,757 30,060 38,685 112,267
Net income per common share:
` Basic $0.33 $0.43 $0.52 $0.66 $1.94
Diluted 0.32 0.42 0.51 0.64 1.90
Weighted average common
shares:
Basic: 57,668 57,671 57,846 58,218 57,851
Diluted: 58,197 58,323 59,016 60,197 58,933
(1) On September 7, 2005, we completed the acquisition of ASA and our fourth quarter operating revenues contain 114 days of additional revenue
generated by the ASA acquisition
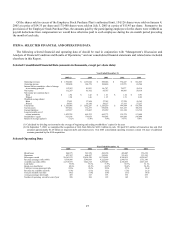
The following terms used in this section and elsewhere in this Report have the meanings indicated below:
"Revenue passenger miles" represents the number of miles flown by revenue passengers.
"Available seat miles" represents the number of seats available for passengers multiplied by the number of miles the
seats are flown.
"Load factor" represents the percentage of aircraft seating capacity that is actually utilized (revenue passenger miles
divided by available seat miles).
"Breakeven load factor" is the passenger load factor that will result in operating revenues being equal to operating
expenses, assuming constant revenue per passenger mile and expenses.
"Yield per passenger mile" represents the average amount one passenger pays to fly one mile.
"Passenger revenue per available seat mile" represents passenger revenue divided by available seat miles.
"Operating cost per available seat mile" represents operating expenses plus interest divided by available seat miles.