SkyWest Airlines 2005 Annual Report Download - page 40
Download and view the complete annual report
Please find page 40 of the 2005 SkyWest Airlines annual report below. You can navigate through the pages in the report by either clicking on the pages listed below, or by using the keyword search tool below to find specific information within the annual report.-
 1
1 -
2
-
3
-
4
-
5
-
6
-
7
-
8
-
9
-
10
-
11
-
12
-
13
-
14
-
15
-
16
-
17
-
18
-
19
-
20
-
21
-
22
-
23
-
24
-
25
-
26
-
27
-
28
-
29
-
 30
30 -
 31
31 -
 32
32 -
 33
33 -
 34
34 -
 35
35 -
 36
36 -
 37
37 -
 38
38 -
 39
39 -
 40
40 -
 41
41 -
 42
42 -
 43
43 -
 44
44 -
 45
45 -
 46
46 -
 47
47 -
 48
48 -
 49
49 -
 50
50 -
51
-
52
-
53
-
54
-
55
-
56
-
57
-
58
-
59
-
60
-
61
-
62
-
63
-
64
-
65
-
66
-
67
-
68
-
69
-
70
-
71
-
72
-
73
-
74
-
75
-
76
-
77
-
78
-
79
-
80
-
81
-
82
-
83
-
84
 |
 |
36
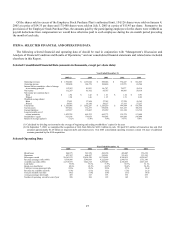
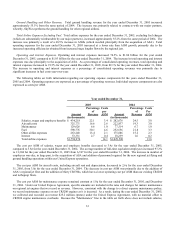
The cost per ASM for aircraft costs, including aircraft rent and depreciation, decreased to 3.0¢ for the year ended December
31, 2004, from 3.4¢ for the year ended December 31, 2003. The decrease in cost per ASM was primarily due to the addition of
twelve CRJ700s, which have a lower operating cost per ASM than our existing aircraft. Additionally, the decrease was due, in
part, to our changing the estimate on depreciable lives of rotable spares from five years to ten years effective January 2004. This
change in estimate increased our pretax income by $11,455,000 for the year ended December 31, 2004. The impact of this
change on costs per ASM for the year ended December 31, 2004 was 0.002¢ and the remaining decrease was primarily due to the
increase in the number of regional jets that were added to our fleet during 2004.
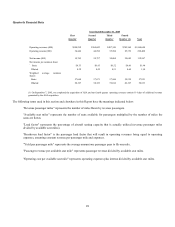
The cost per ASM for maintenance expense increased to 1.0¢ for the year ended December 31, 2004, from 0.9¢ the year ended
December 31, 2003. The increase in cost per ASM was primarily due to the timing of certain maintenance events. Under our
United Express Agreement, specific amounts are included in the rates and charges for mature maintenance on regional jet engines
that we record as revenue. However, consistent with the change to a direct expense maintenance policy, we record maintenance
expense on our CRJ200 engines as it is incurred. As a result, during the year ended December 31, 2004 we collected and
recorded as revenue $23.3 million (pretax) under the United Express Agreement, with no corresponding offset for CRJ200 engine
maintenance overhauls since none were incurred. Because the “Maintenance” line in the table set forth above does not include
salaries, wages and employee benefits associated with our maintenance operations (those costs are stated separately in the table),
the maintenance expense line in the above table differs from the maintenance line in our Condensed Consolidated Statements of
Income set forth in Item 8 below.
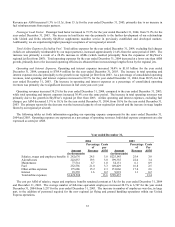
The cost per ASM for fuel increased to 3.3¢ for the year ended December 31, 2004, from 2.5¢ for the year ended December
31, 2003. This increase was primarily due to the average price of fuel increasing to $1.45 per gallon during the year ended
December 31, 2004, from $1.12 per gallon for the year ended December 31, 2003.
The cost per ASM for other expenses, primarily consisting of landing fees, station rentals, computer reservation system fees
and hull and liability insurance, decreased 11.5% to 2.3¢ for the year ended December 31, 2004, from 2.6¢ for the year ended
December 31, 2003. The decrease was primarily related to our elimination of certain reservation and distribution costs which
were previously associated with the United Express Agreement that are now handled directly by United, along with the increase
in stage lengths flown by our regional jets.
Interest expense increased to approximately $18.2 million during the year ended December 31, 2004, from approximately $9.9
million during the year ended December 31, 2003. The increase in interest expense was primarily due to the long-debt financing
of the new regional jets we acquired.
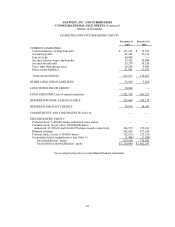
Liquidity and Capital Resources
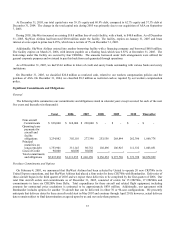
We had working capital of $77.7 million and a current ratio of 1.1:1 at December 31, 2005, compared to working capital of
$536.5 million and a current ratio of 4.1:1 at December 31, 2004. The decrease was principally caused by the use of cash to fund
the acquisition of ASA. The principal sources of cash during the year ended December 31, 2005 were $267.5 million in net
proceeds from the sale and purchase of marketable securities, $207.5 million provided by operating activities, $141.0 million of
proceeds from the issuance of long-term debt, $90.0 million of proceeds from draws under new and existing lines of credit, $36.4
million from returns on aircraft deposits, $11.7 million from proceeds from the sale of leased aircraft, and $21.8 million from the
sale of common stock in connection with the exercise of stock options under our stock option and employee stock purchase plans,
$6.2 million sale of other assets and $4.0 million of proceeds from the sale of owned aircraft. During the year ended December
31, 2005, we paid net of cash acquired from ASA $371.9 million as the purchase price for ASA. We invested $214.2 million in
flight equipment, $101.4 million in deposits for aircraft, and $12.7 million in buildings and ground equipment. We made
principal payments on long-term debt of $51.3 million and paid $7.0 million in cash dividends. These factors resulted in a $27.6
million increase in cash and cash equivalents during the year ended December 31, 2005.
Our position in marketable securities, consisting primarily of bonds, bond funds and commercial paper, decreased to $159
million at December 31, 2005, compared to $427.5 million at December 31, 2004. The decrease in marketable securities was due
primarily to the $421.3 million in purchase price, $5.3 million in transaction fees and $50 million in returns of aircraft deposits we
paid to Delta in connection with our acquisition of ASA on September 7, 2005.