Sharp 2013 Annual Report Download - page 61
Download and view the complete annual report
Please find page 61 of the 2013 Sharp annual report below. You can navigate through the pages in the report by either clicking on the pages listed below, or by using the keyword search tool below to find specific information within the annual report.-
 1
1 -
2
-
3
-
4
-
5
-
6
-
7
-
8
-
9
-
10
-
11
-
12
-
13
-
14
-
15
-
16
-
17
-
18
-
19
-
20
-
21
-
22
-
23
-
24
-
25
-
26
-
27
-
28
-
29
-
30
-
31
-
32
-
33
-
34
-
35
-
36
-
37
-
38
-
39
-
40
-
41
-
42
-
43
-
44
-
45
-
46
-
47
-
48
-
49
-
50
-
 51
51 -
 52
52 -
 53
53 -
 54
54 -
 55
55 -
 56
56 -
 57
57 -
 58
58 -
 59
59 -
 60
60 -
 61
61 -
 62
62 -
 63
63 -
 64
64 -
 65
65 -
 66
66 -
 67
67 -
 68
68 -
 69
69 -
 70
70 -
 71
71 -
72
-
73
 |
 |

Annual Report 2013 59
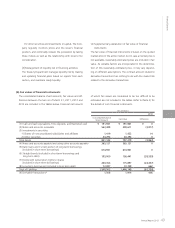
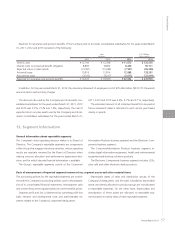
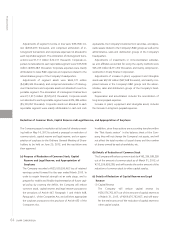
Adjustments of segment income or loss were ¥(31,089) mil-
lion, ¥(33,861) million and ¥(33,954) million ($(365,097) thou-
sand) for the years ended March 31, 2011, 2012 and 2013,
respectively, and comprised elimination of intersegment trans-
actions and corporate expenses not allocated to each report-
able segment. The elimination of intersegment transactions was
¥3,083 million, ¥1,061 million and ¥1,117 million ($12,011
thousand), respectively. Corporate expenses not allocated to
each reportable segment were ¥(35,880) million, ¥(35,704) mil-
lion and ¥(36,306) million ($(390,387) thousand), for the years
ended March 31, 2011, 2012 and 2013, respectively. Corporate
expenses were mainly attributable to basic R&D expenses and
expenses related to the administrative groups of the Company’s
headquarters.
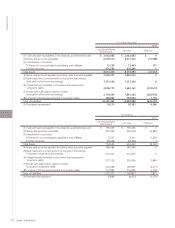
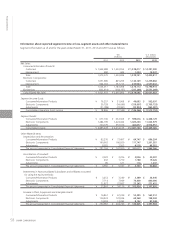
Adjustments of segment assets were ¥723,779 million,
¥557,336 million and ¥462,857 million ($4,976,957 thousand)
as of March 31, 2011, 2012 and 2013, respectively, and com-
prised elimination of intersegment transactions and corporate
assets not allocated to each reportable segment. The elimination
of intersegment transactions was ¥(36,464) million, ¥(18,788)
million and ¥(11,532) million ($(124,000) thousand), respective-
ly. Corporate assets not allocated to each reportable segment
were ¥760,243 million, ¥576,124 million and ¥474,389 million
($5,100,957 thousand), as of March 31, 2011, 2012 and 2013,
respectively. Corporate assets not allocated to each reportable
segment were mainly attributable to cash and cash equivalents,
deferred tax assets, the Company’s investments in securities, and
depreciable assets related to the Company’s R&D groups as well
as the administrative, sales and distribution groups of the Com-
pany’s headquarters.
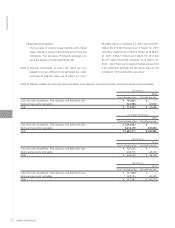
Adjustments of investments in nonconsolidated subsidiar-
ies and affiliates accounted for using the equity method were
¥21,877 million, ¥22,807 million and ¥25,245 million ($271,452
thousand), as of March 31, 2011, 2012 and 2013, respectively,
and mainly comprised investments in Sharp Finance Corpora-
tion.
Adjustments of increase in plant, equipment and intangible
assets were ¥14,900 million, ¥13,493 million and ¥8,142 mil-
lion ($87,548 thousand) for the years ended March 31, 2011,
2012 and 2013, respectively, and mainly comprised increase in
the Company’s R&D groups and the administrative, sales and
distribution groups of the Company’s headquarters.
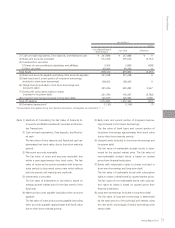
Depreciation and amortization includes the amortization of
long-term prepaid expenses.
Increase in plant, equipment and intangible assets includes
the increase in long-term prepaid expenses.
Financial Section