Sharp 2013 Annual Report Download - page 59
Download and view the complete annual report
Please find page 59 of the 2013 Sharp annual report below. You can navigate through the pages in the report by either clicking on the pages listed below, or by using the keyword search tool below to find specific information within the annual report.-
 1
1 -
2
-
3
-
4
-
5
-
6
-
7
-
8
-
9
-
10
-
11
-
12
-
13
-
14
-
15
-
16
-
17
-
18
-
19
-
20
-
21
-
22
-
23
-
24
-
25
-
26
-
27
-
28
-
29
-
30
-
31
-
32
-
33
-
34
-
35
-
36
-
37
-
38
-
39
-
40
-
41
-
42
-
43
-
44
-
45
-
46
-
47
-
48
-
 49
49 -
 50
50 -
 51
51 -
 52
52 -
 53
53 -
 54
54 -
 55
55 -
 56
56 -
 57
57 -
 58
58 -
 59
59 -
 60
60 -
 61
61 -
 62
62 -
 63
63 -
 64
64 -
 65
65 -
 66
66 -
 67
67 -
 68
68 -
 69
69 -
70
-
71
-
72
-
73
 |
 |

Annual Report 2013 57
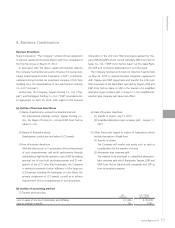
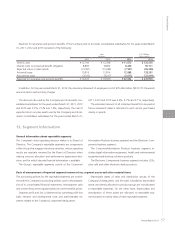
General information about reportable segments
The Company’s chief operating decision maker is its Board of
Directors. The Company’s reportable segments are components
of the Group that engage in business activities, whose operating
results are regularly reviewed by the Board of Directors when
making resource allocation and performance assessment deci-
sions, and for which discrete financial information is available.
The Group’s reportable segments consist of the Consumer/
Information Products business segment and the Electronic Com-
ponents business segment.
The Consumer/Information Products business segment in-
cludes digital information equipment, health and environmental
equipment and business solutions products.
The Electronic Components business segment includes LCDs,
solar cells and other electronic device products.
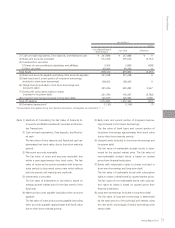
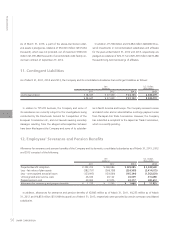
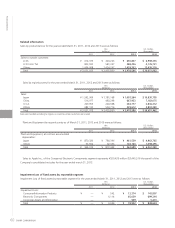
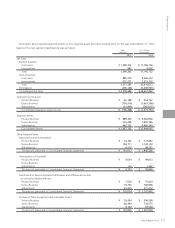
Expenses for severance and pension benefits of the Company and its domestic consolidated subsidiaries for the years ended March
31, 2011, 2012 and 2013 consisted of the following:
In addition, for the year ended March 31, 2013, the voluntary retirement of employees cost of ¥25,496 million ($274,151 thousand)
was included in restructuring charges.
The accounting policies for the reportable segments are consist-
ent with the Company’s accounting policies used in the prepara-
tion of its consolidated financial statements. Intersegment sales
and income (loss) are recognized based on current market prices.
Segment profit and loss is determined as operating profit less
basic research and development costs and administrative ex-
penses related to the Company’s corporate headquarters.
Depreciable assets of sales and distribution groups of the
Company’s headquarters and the sales subsidiaries depreciable
assets not directly allocated to product groups are not allocated
to reportable segments. On the other hand, depreciation and
amortization of these assets are allocated to reportable seg-
ments based on mainly sales of each reportable segment.
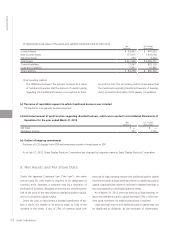
Basis of measurement of reported segment income or loss, segment assets and other material items
The discount rate used by the Company and its domestic con-
solidated subsidiaries for the years ended March 31, 2011, 2012
and 2013 was 2.5%, 2.5% and 1.5%, respectively. The rate of
expected return on plan assets used by the Company and its do-
mestic consolidated subsidiaries for the years ended March 31,
2011, 2012 and 2013 was 4.5%, 3.7% and 3.1%, respectively.
The estimated amount of all retirement benefits to be paid at
future retirement dates is allocated to each service year based
mainly on points.
13. Segment Information
Yen
(millions)
U.S. Dollars
(thousands)
2011 2012 2013 2013
Service costs ¥ 12,700 ¥ 12,398 ¥ 11,672 $ 125,505
Interest costs on projected benefit obligation 8,897 8,832 8,438 90,731
Expected return on plan assets (13,091) (10,458) (7,951) (85,495)
Actuarial losses 10,813 11,814 12,888 138,581
Prior service costs (3,012) (3,017) (3,015) (32,419)
Expenses for severance and pension benefits ¥ 16,307 ¥ 19,569 ¥ 22,032 $ 236,903
Financial Section