Sharp 2013 Annual Report Download - page 45
Download and view the complete annual report
Please find page 45 of the 2013 Sharp annual report below. You can navigate through the pages in the report by either clicking on the pages listed below, or by using the keyword search tool below to find specific information within the annual report.-
 1
1 -
2
-
3
-
4
-
5
-
6
-
7
-
8
-
9
-
10
-
11
-
12
-
13
-
14
-
15
-
16
-
17
-
18
-
19
-
20
-
21
-
22
-
23
-
24
-
25
-
26
-
27
-
28
-
29
-
30
-
31
-
32
-
33
-
34
-
 35
35 -
 36
36 -
 37
37 -
 38
38 -
 39
39 -
 40
40 -
 41
41 -
 42
42 -
 43
43 -
 44
44 -
 45
45 -
 46
46 -
 47
47 -
 48
48 -
 49
49 -
 50
50 -
 51
51 -
 52
52 -
 53
53 -
 54
54 -
 55
55 -
56
-
57
-
58
-
59
-
60
-
61
-
62
-
63
-
64
-
65
-
66
-
67
-
68
-
69
-
70
-
71
-
72
-
73
 |
 |

Annual Report 2013 43
Financial Section
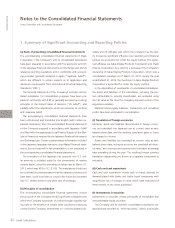
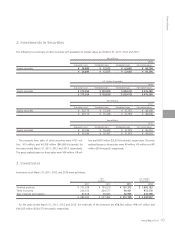
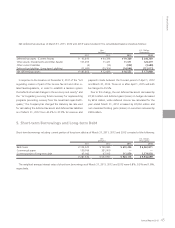
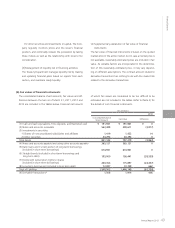
The following is a summary of other securities with available fair market values as of March 31, 2011, 2012 and 2013:
2. Investments in Securities
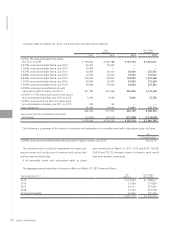
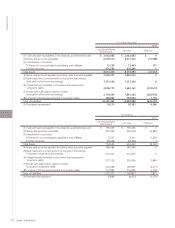
Inventories as of March 31, 2011, 2012 and 2013 were as follows:
3. Inventories
Yen (millions)
2013
Acquisition cost Unrealized gains Unrealized losses Fair market value
Equity securities ¥ 34,880 ¥ 12,075 ¥ (2,661) ¥ 44,294
¥ 34,880 ¥ 12,075 ¥ (2,661) ¥ 44,294
U.S. Dollars (thousands)
2013
Acquisition cost Unrealized gains Unrealized losses Fair market value
Equity securities $ 375,054 $ 129,839 $ (28,613) $ 476,280
$ 375,054 $ 129,839 $ (28,613) $ 476,280
Yen (millions)
2012
Acquisition cost Unrealized gains Unrealized losses Fair market value
Equity securities ¥ 39,715 ¥ 15,428 ¥ (6,735) ¥ 48,408
¥ 39,715 ¥ 15,428 ¥ (6,735) ¥ 48,408
Yen (millions)
2011
Acquisition cost Unrealized gains Unrealized losses Fair market value
Equity securities ¥ 39,186 ¥ 16,343 ¥ (6,105) ¥ 49,424
¥ 39,186 ¥ 16,343 ¥ (6,105) ¥ 49,424
Yen
(millions)
U.S. Dollars
(thousands)
2011 2012 2013 2013
Finished products ¥ 191,628 ¥ 194,220 ¥ 157,373 $ 1,692,183
Work in process 206,614 264,577 90,431 972,376
Raw materials and supplies 87,818 68,686 62,905 676,398
¥ 486,060 ¥ 527,483 ¥ 310,709 $ 3,340,957
The proceeds from sales of other securities were ¥131 mil-
lion, ¥13 million, and ¥4,358 million ($46,860 thousands) for
the years ended March 31, 2011, 2012 and 2013, respectively.
The gross realized gains on those sales were ¥24 million, ¥8 mil-
For the years ended March 31, 2011, 2012 and 2013, the write-offs of the inventory are ¥38,240 million, ¥98,147 million and
¥46,925 million ($504,570 thousand), respectively.
lion and ¥307 million ($3,301 thousands), respectively. The gross
realized losses on those sales were ¥0 million, ¥0 million and ¥0
million ($0 thousand), respectively.