Sharp 2013 Annual Report Download - page 36
Download and view the complete annual report
Please find page 36 of the 2013 Sharp annual report below. You can navigate through the pages in the report by either clicking on the pages listed below, or by using the keyword search tool below to find specific information within the annual report.-
 1
1 -
2
-
3
-
4
-
5
-
6
-
7
-
8
-
9
-
10
-
11
-
12
-
13
-
14
-
15
-
16
-
17
-
18
-
19
-
20
-
21
-
22
-
23
-
24
-
25
-
 26
26 -
 27
27 -
 28
28 -
 29
29 -
 30
30 -
 31
31 -
 32
32 -
 33
33 -
 34
34 -
 35
35 -
 36
36 -
 37
37 -
 38
38 -
 39
39 -
 40
40 -
 41
41 -
 42
42 -
 43
43 -
 44
44 -
 45
45 -
 46
46 -
47
-
48
-
49
-
50
-
51
-
52
-
53
-
54
-
55
-
56
-
57
-
58
-
59
-
60
-
61
-
62
-
63
-
64
-
65
-
66
-
67
-
68
-
69
-
70
-
71
-
72
-
73
 |
 |

34 SHARP CORPORATION
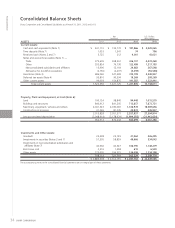
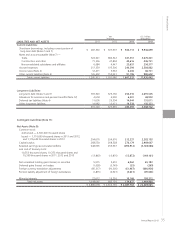
Consolidated Balance Sheets
Sharp Corporation and Consolidated Subsidiaries as of March 31, 2011, 2012 and 2013
Financial Section
Yen
(millions)
U.S. Dollars
(thousands)
ASSETS 2011 2012 2013 2013
Current Assets:
Cash and cash equivalents (Note 7) ¥ 241,110 ¥ 193,772 ¥ 187,866 $ 2,020,065
Time deposits (Note 7) 1,053 1,341 74 796
Restricted cash (Notes 2 and 7) 5,725 212 4,001 43,021
Notes and accounts receivable (Note 7) —
Trade 379,609 368,561 416,107 4,474,269
Other 202,824 76,730 122,499 1,317,193
Nonconsolidated subsidiaries and affiliates 15,996 12,164 24,882 267,548
Allowance for doubtful receivables (2,730) (4,407) (5,259) (56,548)
Inventories (Note 3) 486,060 527,483 310,709 3,340,957
Deferred tax assets (Note 4) 93,810 90,394 19,369 208,269
Other current assets 99,093 154,875 141,587 1,522,441
Total current assets 1,522,550 1,421,125 1,221,835 13,138,011
Property, Plant and Equipment, at Cost (Note 6):
Land 100,124 98,840 94,448 1,015,570
Buildings and structures 840,912 841,205 713,657 7,673,731
Machinery, equipment, vehicles and others 2,041,523 2,030,081 1,726,978 18,569,656
Construction in progress 31,269 81,245 22,874 245,957
3,013,828 3,051,371 2,557,957 27,504,914
Less accumulated depreciation (2,048,914) (2,178,929) (1,994,258) (21,443,634)
964,914 872,442 563,699 6,061,280
Investments and Other Assets:
Goodwill 24,338 23,129 21,064 226,495
Investments in securities (Notes 2 and 7) 57,505 58,859 49,666 534,043
Investments in nonconsolidated subsidiaries and
affiliates (Note 7) 40,960 40,547 106,790 1,148,279
Bond issue cost 2,316 1,458 610 6,559
Other assets 273,095 196,575 124,099 1,334,398
398,214 320,568 302,229 3,249,774
¥ 2,885,678 ¥ 2,614,135 ¥ 2,087,763 $ 22,449,065
The accompanying notes to the consolidated financial statements are an integral part of these statements.