Sharp 2013 Annual Report Download - page 33
Download and view the complete annual report
Please find page 33 of the 2013 Sharp annual report below. You can navigate through the pages in the report by either clicking on the pages listed below, or by using the keyword search tool below to find specific information within the annual report.-
 1
1 -
2
-
3
-
4
-
5
-
6
-
7
-
8
-
9
-
10
-
11
-
12
-
13
-
14
-
15
-
16
-
17
-
18
-
19
-
20
-
21
-
22
-
 23
23 -
 24
24 -
 25
25 -
 26
26 -
 27
27 -
 28
28 -
 29
29 -
 30
30 -
 31
31 -
 32
32 -
 33
33 -
 34
34 -
 35
35 -
 36
36 -
 37
37 -
 38
38 -
 39
39 -
 40
40 -
 41
41 -
 42
42 -
 43
43 -
44
-
45
-
46
-
47
-
48
-
49
-
50
-
51
-
52
-
53
-
54
-
55
-
56
-
57
-
58
-
59
-
60
-
61
-
62
-
63
-
64
-
65
-
66
-
67
-
68
-
69
-
70
-
71
-
72
-
73
 |
 |

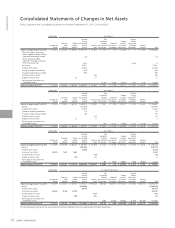
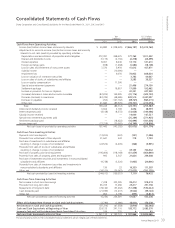
Annual Report 2013 31
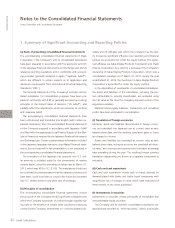
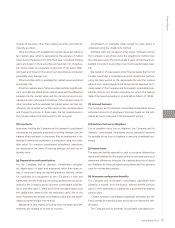
Financial Section
[Reference Information]
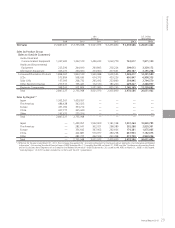
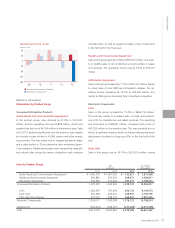
Information by Product Group
Consumer/Information Products
Audio-Visual and Communication Equipment
In this product group, sales declined by 31.0% to ¥732,651
million, and the operating loss was ¥9,858 million, which was
greater than the loss of ¥6,194 million in the previous year. Sales
of LCD TVs declined significantly over the previous year, despite
an increase in sales volume in ASEAN nations and other emerg-
ing countries. This was mainly due to sluggish demand in Japan
and a sales decline in China stemming from worsening Japan–
China relations. Mobile phone sales were impacted by languish-
ing volume sales caused by severe competition with overseas
manufacturers, as well as supply shortages of key components
in the first half of the fiscal year.
Health and Environmental Equipment
Sales in this group grew by 5.9% to ¥309,673 million, due main-
ly to healthy sales of air conditioners and air purifiers in Japan
and overseas. The operating income rose by 9.3% to ¥32,210
million.
Information Equipment
Sales in this group increased by 7.1% to ¥297,417 million, thanks
to robust sales of color MFPs and information displays. The op-
erating income decreased by 12.3% to ¥24,343 million, due
mainly to falling prices stemming from intensified competition.
Electronic Components
LCDs
Sales in this group increased by 17.4% to ¥846,716 million.
This was due mainly to increased sales of small- and medium-
size LCDs for smartphones and tablet terminals. The operating
loss amounted to ¥138,991 million, compared with a loss of
¥42,236 million in the previous year. This was primarily due to
efforts to optimize inventory levels, including making production
adjustments at plants for large-size LCDs in the first half of the
year.
Solar Cells
Sales in this group rose by 16.1% to ¥259,916 million, owing
-160
-120
-80
-40
0
40
80
Consumer/Information Products
Electronic Components
09 10 11 12 13
Operating Income (Loss)
(billions of yen)
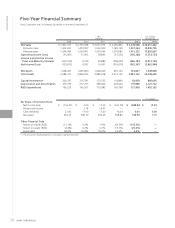
Sales by Product Group Yen
(millions)
U.S. Dollars
(thousands)
2011 2012 2013 2013
Audio-Visual and Communication Equipment ¥ 1,426,734 ¥ 1,061,092 ¥ 732,651 $ 7,877,968
Health and Environmental Equipment 269,883 292,303 309,673 3,329,817
Information Equipment 273,953 277,604 297,417 3,198,032
Consumer/Information Products 1,970,570 1,630,999 1,339,741 14,405,817
LCDs 1,026,959 720,978 846,716 9,104,473
Solar Cells 265,538 223,916 259,916 2,794,796
Other Electronic Devices 261,520 238,114 269,481 2,897,645
Electronic Components 1,554,017 1,183,008 1,376,113 14,796,914
Adjustments (502,614) (358,157) (237,268) (2,551,269)
Total 3,021,973 2,455,850 2,478,586 26,651,462