Sharp 2013 Annual Report Download - page 12
Download and view the complete annual report
Please find page 12 of the 2013 Sharp annual report below. You can navigate through the pages in the report by either clicking on the pages listed below, or by using the keyword search tool below to find specific information within the annual report.-
 1
1 -
 2
2 -
 3
3 -
 4
4 -
 5
5 -
 6
6 -
 7
7 -
 8
8 -
 9
9 -
 10
10 -
 11
11 -
 12
12 -
 13
13 -
 14
14 -
 15
15 -
 16
16 -
 17
17 -
 18
18 -
 19
19 -
 20
20 -
 21
21 -
 22
22 -
23
-
24
-
25
-
26
-
27
-
28
-
29
-
30
-
31
-
32
-
33
-
34
-
35
-
36
-
37
-
38
-
39
-
40
-
41
-
42
-
43
-
44
-
45
-
46
-
47
-
48
-
49
-
50
-
51
-
52
-
53
-
54
-
55
-
56
-
57
-
58
-
59
-
60
-
61
-
62
-
63
-
64
-
65
-
66
-
67
-
68
-
69
-
70
-
71
-
72
-
73
 |
 |

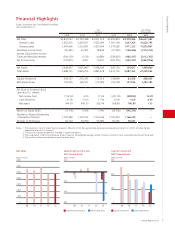
Optimization of Inventory Level
0
300
600
1
2
3
(billions of yen) (months)
11 12 13
(Fiscal year-ends)
527.4
310.7
2.58
1.50 1.40
Inventories (left axis)
Inventory ratio against monthly turnover (right axis)
Minimization of Capital Investment
0
50
100
150
2
3
4
5
(billions of yen) (%)
11 12 13
(Fiscal years)
118.8
82.4
4.8
3.3 3.0
LCD-related investments (left axis)
Non-LCD-related investments (left axis)
Ratio of sales to capital investment (right axis)
Cutting Down on Interest-Bearing Debt
0
300
600
900
1,200
(billions of yen)
11 12 13
(Fiscal year-ends)
Loans from financial institutions Commercial paper
Convertible bonds Straight bonds
1,127.1 1,174.4
10 SHARP CORPORATION
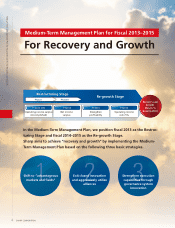
Medium-Term Management Plan for Fiscal 2013-2015: For Recovery and Growth
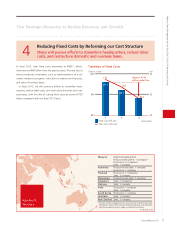
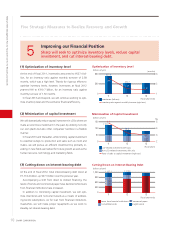
5Improving our Financial Position
Sharp will seek to optimize inventory levels, reduce capital
investment, and cut interest-bearing debt.
(1) Optimization of inventory level
At the end of fiscal 2011, inventories amounted to ¥527.4 bil-
lion, for an inventory ratio against monthly turnover of 2.58
months, which was a high level. Thanks for rigorous efforts to
optimize inventory levels, however, inventories at fiscal 2012
year-end fell to ¥310.7 billion, for an inventory ratio against
monthly turnover of 1.50 months.
In fiscal 2013 and beyond, we will continue working to opti-
mize inventory level and thus enhance financial efficiency.
(2) Minimization of capital investment
We will dramatically reduce capital investment in LCDs where we
made an enormous investment in the past, by utilizing not only
our own plants but also other companies’ facilities in a flexible
manner.
In fiscal 2013 and thereafter, while limiting capital investment
to essential outlays to production and sales such as mold and
masks, we will pursue an efficient investment by primarily in-
vesting in new fields earmarked for future growth as well as the
human resource, technology, and marketing fields.
(3) Cutting down on interest-bearing debt
At the end of fiscal 2012, total interest-bearing debt stood at
¥1,174.4 billion, up ¥47.3 billion over the previous year.
Accompanying a shift from direct to indirect financing, the
levels of bonds and commercial paper have declined while loans
from financial institutions have increased.
In addition to minimizing capital investment, we will opti-
mize inventories and noncurrent assets as a means of address-
ing bonds redemptions. As for loan from financial institutions,
meanwhile, we will make proper repayments as we work to
steadily cut interest-bearing debt.
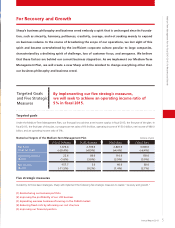
Five Strategic Measures to Realize Recovery and Growth