Sharp 2013 Annual Report Download - page 34
Download and view the complete annual report
Please find page 34 of the 2013 Sharp annual report below. You can navigate through the pages in the report by either clicking on the pages listed below, or by using the keyword search tool below to find specific information within the annual report.-
 1
1 -
2
-
3
-
4
-
5
-
6
-
7
-
8
-
9
-
10
-
11
-
12
-
13
-
14
-
15
-
16
-
17
-
18
-
19
-
20
-
21
-
22
-
23
-
 24
24 -
 25
25 -
 26
26 -
 27
27 -
 28
28 -
 29
29 -
 30
30 -
 31
31 -
 32
32 -
 33
33 -
 34
34 -
 35
35 -
 36
36 -
 37
37 -
 38
38 -
 39
39 -
 40
40 -
 41
41 -
 42
42 -
 43
43 -
 44
44 -
45
-
46
-
47
-
48
-
49
-
50
-
51
-
52
-
53
-
54
-
55
-
56
-
57
-
58
-
59
-
60
-
61
-
62
-
63
-
64
-
65
-
66
-
67
-
68
-
69
-
70
-
71
-
72
-
73
 |
 |

32 SHARP CORPORATION
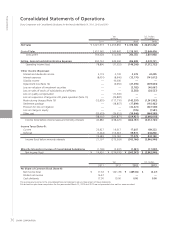
mainly to higher sales in residential as well as industrial use ap-
plications in Japan, including mega-solar power generation. The
operating loss totaled ¥4,497 million, which improved from the
loss of ¥21,982 million in the previous year. The decrease in sell-
ing prices stemming from intensified competition resulted in the
operating loss.
Other Electronic Devices
Sales in this group increased by 13.2% to ¥269,481 million,
thanks mainly to growth in sales of camera modules for smart-
phones and tablet terminals, as well as higher sales of LEDs. The
operating loss was ¥15,519 million, compared with operating
income of ¥9,519 million in the previous year. This was primarily
due to efforts to optimize inventory levels.
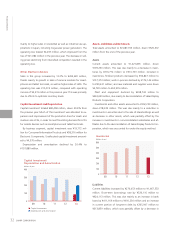
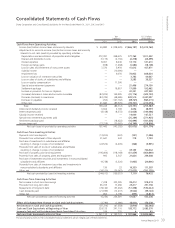
Capital Investment and Depreciation
Capital investment totaled ¥82,458 million, down 30.6% from
the previous year. Much of this investment was allocated to ex-
pansion and improvement of the production lines for small- and
medium-size LCDs, in order to meet flourishing demand for LCDs
for mobile devices such as smartphones and tablet terminals.
By business segment, capital investment was ¥19,772 mil-
lion for Consumer/Information Products and ¥58,316 million for
Electronic Components. Unallocated capital investment amount-
ed to ¥4,370 million.
Depreciation and amortization declined by 26.4% to
¥197,880 million.
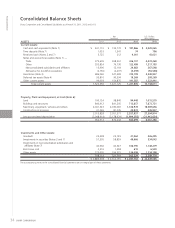
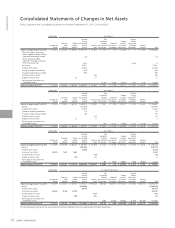
Assets, Liabilities and Net Assets
Total assets amounted to ¥2,087,763 million, down ¥526,372
million from the end of the previous year.
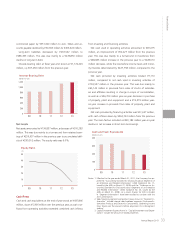
Assets
Current assets amounted to ¥1,221,835 million, down
¥199,290 million. This was due mainly to a decrease in inven-
tories by ¥216,774 million to ¥310,709 million. Included in
inventories, finished products decreased by ¥36,847 million to
¥157,373 million; work in process declined by ¥174,146 million
to ¥90,431 million; and raw materials and supplies were down
¥5,781 million to ¥62,905 million.
Plant and equipment declined by ¥308,743 million to
¥563,699 million, due mainly to deconsolidation of Sakai Display
Products Corporation.
Investments and other assets amounted to ¥302,229 million,
down ¥18,339 million. This was due mainly to a reduction in
investments in securities due to the sale of shareholdings as well
as decrease in other assets, which was partially offset by the
increase in investments in nonconsolidated subsidiaries and af-
filiates due to the deconsolidation of Sakai Display Products Cor-
poration, which was accounted for under the equity method.
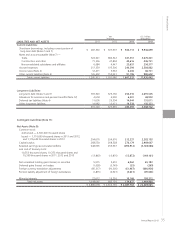
Liabilities
Current liabilities increased by ¥276,453 million to ¥1,667,533
million. Short-term borrowings rose by ¥326,116 million to
¥924,113 million. This was due mainly to an increase in bank
loans by ¥411,169 million to ¥610,254 million and an increase
in current portion of long-term debt by ¥265,947 million to
¥313,859 million, which was partially offset by a decrease in
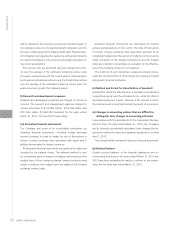
0
100
200
300
400
Capital investment
Depreciation and amortization
09 10 11 12 13
Capital Investment/
Depreciation and Amortization
(billions of yen)
0
100
200
300
400
500
600
09 10 11 12 13
Inventories
(billions of yen)
Financial Section