Sharp 2013 Annual Report Download - page 35
Download and view the complete annual report
Please find page 35 of the 2013 Sharp annual report below. You can navigate through the pages in the report by either clicking on the pages listed below, or by using the keyword search tool below to find specific information within the annual report.-
 1
1 -
2
-
3
-
4
-
5
-
6
-
7
-
8
-
9
-
10
-
11
-
12
-
13
-
14
-
15
-
16
-
17
-
18
-
19
-
20
-
21
-
22
-
23
-
24
-
 25
25 -
 26
26 -
 27
27 -
 28
28 -
 29
29 -
 30
30 -
 31
31 -
 32
32 -
 33
33 -
 34
34 -
 35
35 -
 36
36 -
 37
37 -
 38
38 -
 39
39 -
 40
40 -
 41
41 -
 42
42 -
 43
43 -
 44
44 -
 45
45 -
46
-
47
-
48
-
49
-
50
-
51
-
52
-
53
-
54
-
55
-
56
-
57
-
58
-
59
-
60
-
61
-
62
-
63
-
64
-
65
-
66
-
67
-
68
-
69
-
70
-
71
-
72
-
73
 |
 |

Annual Report 2013 33
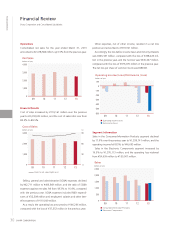
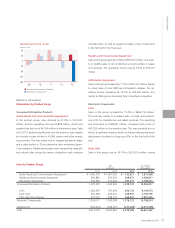
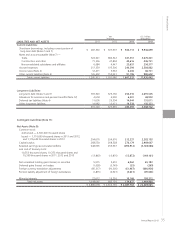
commercial paper by ¥351,000 million to zero. Notes and ac-
counts payable declined by ¥30,949 million to ¥405,624 million.
Long-term liabilities decreased by ¥292,542 million to
¥285,393 million. This was due mainly to a ¥278,850 million
decline in long-term debt.
Interest-bearing debt at fiscal year-end stood at ¥1,174,423
million, up ¥47,266 million from the previous year.
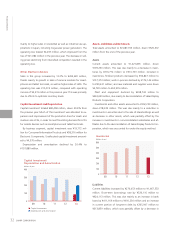
Net Assets
Net assets amounted to ¥134,837 million, a decrease of ¥510,283
million. This was due mainly to a turnaround from retained earn-
ings of ¥259,937 million in the previous year to accumulated defi-
cits of ¥290,912 million. The equity ratio was 6.0%.
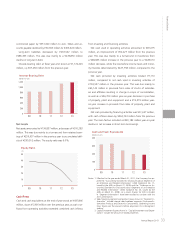
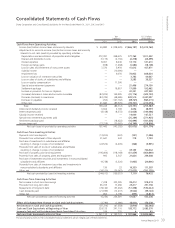
Cash Flows
Cash and cash equivalents at the end of year stood at ¥187,866
million, down ¥5,906 million over the previous year, as cash out-
flows from operating activities exceeded combined cash inflows
from investing and financing activities.
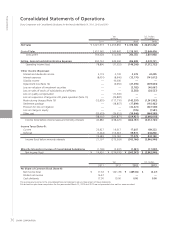
Net cash used in operating activities amounted to ¥81,075
million, an improvement of ¥62,227 million from the previous
year. This was due mainly to a turnaround in inventories from
a ¥48,686 million increase in the previous year to a ¥228,510
million decrease, while the loss before income taxes and minor-
ity interests deteriorated by ¥227,758 million, compared to the
previous year.
Net cash provided by investing activities totaled ¥7,110
million, compared to net cash used in investing activities of
¥159,557 million in the previous year. This was due mainly to
¥65,143 million in proceeds from sales of stocks of subsidiar-
ies and affiliates resulting in change in scope of consolidation,
as well as a ¥56,709 million year-on-year decrease in purchase
of property, plant and equipment and a ¥19,279 million year-
on-year increase in proceeds from sales of property, plant and
equipment.
Net cash provided by financing activities was ¥51,637 million,
with cash inflows down by ¥204,744 million from the previous
year. The main factors included a ¥220,182 million year-on-year
decline in net increase in short-term borrowings.
0
200
400
600
800
1,000
1,200
09 10 11 12 13
Interest-Bearing Debt
(billions of yen)
0
10
20
30
40
50
09 10 11 12 13
Equity Ratio
(%)
0
100
200
300
400
09 10 11 12 13
Cash and Cash Equivalents
(billions of yen)
Notes: 1. Effective for the year ended March 31, 2011, the Company has ap-
plied the “Accounting Standard for Disclosures about Segments of
an Enterprise and Related Information” (ASBJ Statement No. 17,
issued by the ASBJ on March 27, 2009) and the “Guidance on Ac-
counting Standard for Disclosures about Segments of an Enterprise
and Related Information” (ASBJ Guidance No. 20, issued by the
ASBJ on March 21, 2008). As a result, figures for 2010 included
in “Segment Information” have been restated to conform with the
2011 presentation.
2. Sales figures by segment and product group shown in “Segment In-
formation” include internal sales between segments (Consumer/In-
formation Products and Electronic Components). Operating income
(loss) figures are the amounts before adjustment for intersegment
trading.
3. Capital investment figures shown in “Capital Investment and Depre-
ciation” include the amount of leased properties.
Financial Section