Sharp 2013 Annual Report Download - page 16
Download and view the complete annual report
Please find page 16 of the 2013 Sharp annual report below. You can navigate through the pages in the report by either clicking on the pages listed below, or by using the keyword search tool below to find specific information within the annual report.-
 1
1 -
2
-
3
-
4
-
5
-
 6
6 -
 7
7 -
 8
8 -
 9
9 -
 10
10 -
 11
11 -
 12
12 -
 13
13 -
 14
14 -
 15
15 -
 16
16 -
 17
17 -
 18
18 -
 19
19 -
 20
20 -
 21
21 -
 22
22 -
 23
23 -
 24
24 -
 25
25 -
 26
26 -
27
-
28
-
29
-
30
-
31
-
32
-
33
-
34
-
35
-
36
-
37
-
38
-
39
-
40
-
41
-
42
-
43
-
44
-
45
-
46
-
47
-
48
-
49
-
50
-
51
-
52
-
53
-
54
-
55
-
56
-
57
-
58
-
59
-
60
-
61
-
62
-
63
-
64
-
65
-
66
-
67
-
68
-
69
-
70
-
71
-
72
-
73
 |
 |

14 SHARP CORPORATION
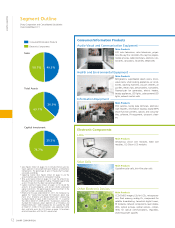
売上高構成比 営業利益(損失)
(十億円)
売上高
(十億円)
31.2%
31.2%
売上高構成比 営業利益(損失)
(十億円)
売上高
(十億円)
9.6%
9.6%
売上高構成比 営業利益(損失)
(十億円)
売上高
(十億円)
9.9%
9.9%
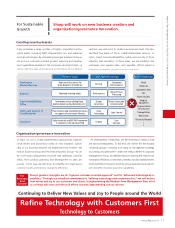
• Sales gures shown on pages 14-15 include internal sales between segments (Consumer/Information Products and Electronic Components). The percentage of sales in pie charts has been
• Operating income (loss) gures shown on page 14-15 are the amounts before adjustments of intersegment trading.
• Effective for the year ended March 31, 2011, the Company has applied the “Accounting Standard for Disclosures about Segments of an Enterprise and Related Information” (Accounting
売上高構成比 営業利益
(十億円)
売上高
(十億円)
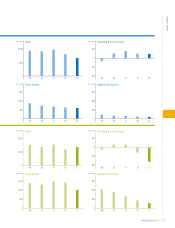
0
100
200
300
400
09 10 11 12 13
0
10
20
30
40
09 10 11 12 13
Operating IncomeSales
(billions of yen) (billions of yen)
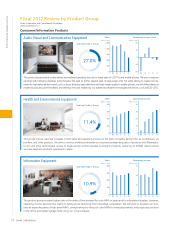
11.4%
11.4%
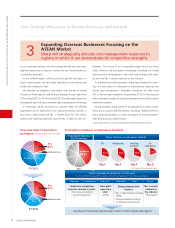
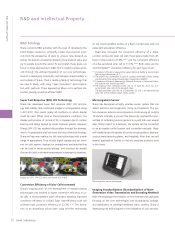
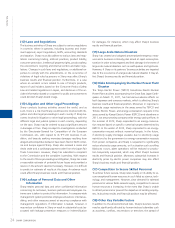
Sales by Product Group
Health and Environmental Equipment
This product group reported increases in both sales and operating income on the back of healthy demand for air conditioners, air
purifiers, and other products. We aim to continue working to broaden our business by expanding sales of products with Plasmaclus-
ter Ion and other technologies unique to Sharp and by reinforcing sales in emerging markets, centering on ASEAN nations where
we have sales and products operations in place.
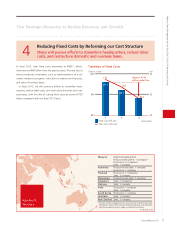
Consumer/Information Products
売上高構成比 営業利益(損失)
(十億円)
売上高
(十億円)
Operating Income (Loss)
(billions of yen) (billions of yen)
Sales
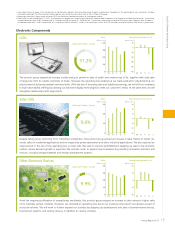
0
300
600
900
1,200
1,500
09 10 11 12 13
-60
-30
0
30
60
09 10 11 12 13
27.0%
Sales by Product Group
27.0%
This product group posted a sales decline and widened operating loss due to lower sales of LCD TVs and mobile phones. We aim to improve
earnings with following initiatives going forward. We seek to further expand sales of large-screen LCD TVs while striving to create new de-
mand for high-value-added models, such as those featuring high-definition and high-image-quality. In mobile phones, we will differentiate our
models by pursuing user-friendliness and offering new uses enabled by our advanced software technologies and devices, such as IGZO LCDs.
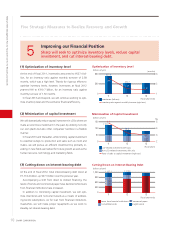
Audio-Visual and Communication Equipment
売上高構成比 営業利益
(十億円)
売上高
(十億円)
0
100
200
300
400
09 10 11 12 13
0
10
20
30
09 10 11 12 13
Operating IncomeSales
(billions of yen) (billions of yen)
10.9%
10.9%
Sales by Product Group
This product group recorded higher sales in the wake of firm demand for color MFPs in Japan and for information displays. However,
operating income declined due mainly to falling prices stemming from intensified competition. We will work to broaden our busi-
ness by expanding sales of high-speed MFPs, strengthening our lineup of color MFPs for emerging markets, and proposing solutions
in the office and digital signage fields using our unique displays.
Information Equipment
Fiscal 2012 Review by Product Group
Fiscal 2012 Review by Product Group
Sharp Corporation and Consolidated Subsidiaries
Years Ended March 31