Sharp 2013 Annual Report Download - page 30
Download and view the complete annual report
Please find page 30 of the 2013 Sharp annual report below. You can navigate through the pages in the report by either clicking on the pages listed below, or by using the keyword search tool below to find specific information within the annual report.-
 1
1 -
2
-
3
-
4
-
5
-
6
-
7
-
8
-
9
-
10
-
11
-
12
-
13
-
14
-
15
-
16
-
17
-
18
-
19
-
 20
20 -
 21
21 -
 22
22 -
 23
23 -
 24
24 -
 25
25 -
 26
26 -
 27
27 -
 28
28 -
 29
29 -
 30
30 -
 31
31 -
 32
32 -
 33
33 -
 34
34 -
 35
35 -
 36
36 -
 37
37 -
 38
38 -
 39
39 -
 40
40 -
41
-
42
-
43
-
44
-
45
-
46
-
47
-
48
-
49
-
50
-
51
-
52
-
53
-
54
-
55
-
56
-
57
-
58
-
59
-
60
-
61
-
62
-
63
-
64
-
65
-
66
-
67
-
68
-
69
-
70
-
71
-
72
-
73
 |
 |

28 SHARP CORPORATION
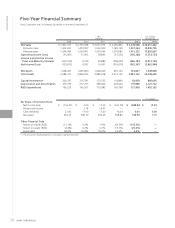
Five-Year Financial Summary
Sharp Corporation and Consolidated Subsidiaries for the Years Ended March 31
Yen
(millions)
U.S. Dollars
(thousands)
2009 2010 2011 2012 2013 2013
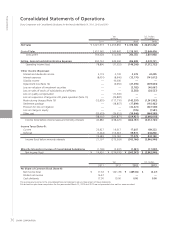
Net Sales ¥ 2,847,227 ¥ 2,755,948 ¥ 3,021,973 ¥ 2,455,850 ¥ 2,478,586 $ 26,651,462
Domestic sales 1,302,261 1,429,057 1,592,909 1,181,168 1,007,264 10,830,795
Overseas sales 1,544,966 1,326,891 1,429,064 1,274,682 1,471,322 15,820,667
Operating Income (Loss) (55,481) 51,903 78,896 (37,552) (146,266) (1,572,753)
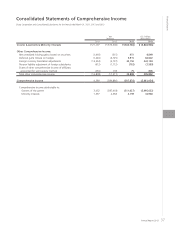
Income (Loss) before Income
Taxes and Minority Interests (204,139) 6,139 40,880 (238,429) (466,187) (5,012,763)
Net Income (Loss) (125,815) 4,397 19,401 (376,076) (545,347) (5,863,946)
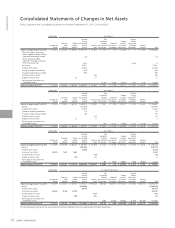
Net Assets 1,048,447 1,065,860 1,048,645 645,120 134,837 1,449,860
Total Assets 2,688,721 2,836,255 2,885,678 2,614,135 2,087,763 22,449,065
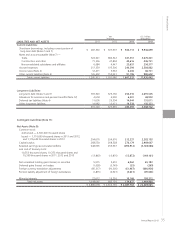
Capital Investment*1260,337 215,781 172,553 118,899 82,458 886,645
Depreciation and Amortization
315,799 277,257 289,602 269,020 197,880 2,127,742
R&D Expenditures 195,525 166,507 173,983 154,798 137,936 1,483,183
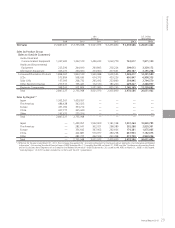
Yen U.S. Dollars
Per Share of Common Stock
Net income (loss) ¥ (114.33) ¥ 4.00 ¥ 17.63 ¥ (341.78) ¥ (489.83) $ (5.27)
Diluted net income — 3.78 16.47 — — —
Cash dividends 21.00 17.00 17.00 10.00 0.00 0.00
Net assets 944.24 949.19 932.46 568.83 106.90 1.15
Other Financial Data
Return on equity (ROE) (11.1%) 0.4% 1.9% (45.5%) (145.3%) —
Return on assets (ROA) (4.4%) 0.2% 0.7% (13.7%) (23.2%) —
Equity ratio 38.6% 36.8% 35.6% 23.9% 6.0% —
*1 The amount of leased properties is included in capital investment.
Financial Section