Sharp 2013 Annual Report Download - page 32
Download and view the complete annual report
Please find page 32 of the 2013 Sharp annual report below. You can navigate through the pages in the report by either clicking on the pages listed below, or by using the keyword search tool below to find specific information within the annual report.-
 1
1 -
2
-
3
-
4
-
5
-
6
-
7
-
8
-
9
-
10
-
11
-
12
-
13
-
14
-
15
-
16
-
17
-
18
-
19
-
20
-
21
-
 22
22 -
 23
23 -
 24
24 -
 25
25 -
 26
26 -
 27
27 -
 28
28 -
 29
29 -
 30
30 -
 31
31 -
 32
32 -
 33
33 -
 34
34 -
 35
35 -
 36
36 -
 37
37 -
 38
38 -
 39
39 -
 40
40 -
 41
41 -
 42
42 -
43
-
44
-
45
-
46
-
47
-
48
-
49
-
50
-
51
-
52
-
53
-
54
-
55
-
56
-
57
-
58
-
59
-
60
-
61
-
62
-
63
-
64
-
65
-
66
-
67
-
68
-
69
-
70
-
71
-
72
-
73
 |
 |

30 SHARP CORPORATION
Financial Section
Financial Review
Sharp Corporation and Consolidated Subsidiaries
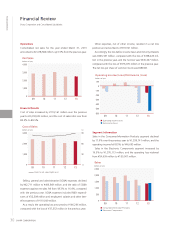
Operations
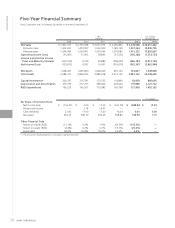
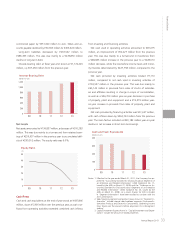
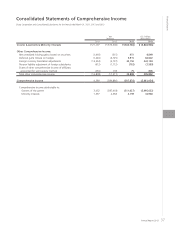
Consolidated net sales for the year ended March 31, 2013
amounted to ¥2,478,586 million, up 0.9% from the previous year.
Financial Results
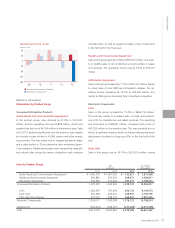
Cost of sales increased by ¥174,161 million over the previous
year to ¥2,218,003 million, and the cost of sales ratio rose from
83.2% to 89.5%.
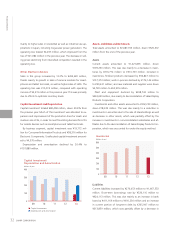
Selling, general and administrative (SG&A) expenses declined
by ¥42,711 million to ¥406,849 million, and the ratio of SG&A
expenses against net sales fell from 18.3% to 16.4%, compared
with the previous year. SG&A expenses included R&D expendi-
tures of ¥32,508 million and employees’ salaries and other ben-
efits expenses of ¥110,009 million.
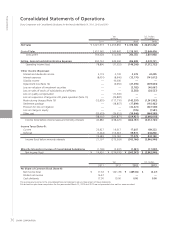
As a result, the operating loss amounted to ¥146,266 million,
compared with the loss of ¥37,552 million in the previous year.
Other expenses, net of other income, resulted in a net loss
position and amounted to ¥319,921 million.
Accordingly, the loss before income taxes and minority interests
was ¥466,187 million, compared with the loss of ¥238,429 mil-
lion in the previous year, and the net loss was ¥545,347 million,
compared with the loss of ¥376,076 million in the previous year.
The net loss per share of common stock was ¥489.83.
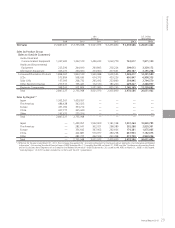
Segment Information
Sales in the Consumer/Information Products segment declined
by 17.9% over the previous year to ¥1,339,741 million, and the
operating income fell 8.5% to ¥46,695 million.
Sales in the Electronic Components segment increased by
16.3% to ¥1,376,113 million, and the operating loss widened
from ¥54,699 million to ¥159,007 million.
0
500
1,000
1,500
2,000
2,500
Consumer/Information Products
Electronic Components
09 10 11 12 13
Sales
(billions of yen)
0
1,000
2,000
3,000
0
30
60
90
Ratio to net sales [right axis]
Cost of Sales
09 10 11 12 13
(billions of yen) (%)
0
1,000
2,000
3,000
4,000
09 10 11 12 13
Net Sales
(billions of yen)
-600
-500
-400
-300
-200
-100
0
100
Operating income (loss)
Net income (loss)
09 10 11 12 13
Operating Income (Loss)/Net Income (Loss)
(billions of yen)