Sharp 2013 Annual Report Download - page 60
Download and view the complete annual report
Please find page 60 of the 2013 Sharp annual report below. You can navigate through the pages in the report by either clicking on the pages listed below, or by using the keyword search tool below to find specific information within the annual report.-
 1
1 -
2
-
3
-
4
-
5
-
6
-
7
-
8
-
9
-
10
-
11
-
12
-
13
-
14
-
15
-
16
-
17
-
18
-
19
-
20
-
21
-
22
-
23
-
24
-
25
-
26
-
27
-
28
-
29
-
30
-
31
-
32
-
33
-
34
-
35
-
36
-
37
-
38
-
39
-
40
-
41
-
42
-
43
-
44
-
45
-
46
-
47
-
48
-
49
-
 50
50 -
 51
51 -
 52
52 -
 53
53 -
 54
54 -
 55
55 -
 56
56 -
 57
57 -
 58
58 -
 59
59 -
 60
60 -
 61
61 -
 62
62 -
 63
63 -
 64
64 -
 65
65 -
 66
66 -
 67
67 -
 68
68 -
 69
69 -
 70
70 -
71
-
72
-
73
 |
 |

58 SHARP CORPORATION
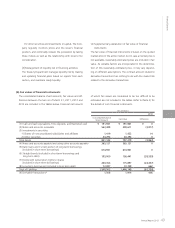
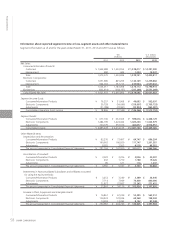
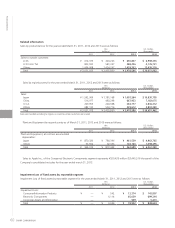
Information about reported segment income or loss, segment assets and other material items
Segment information as of and for the years ended March 31, 2011, 2012 and 2013 was as follows:
Yen
(millions)
U.S. Dollars
(thousands)
2011 2012 2013 2013
Net Sales:
Consumer/Information Products:
Customers ¥ 1,969,988 ¥ 1,630,555 ¥ 1,338,417 $ 14,391,580
Intersegment 582 444 1,324 14,237
Total 1,970,570 1,630,999 1,339,741 14,405,817
Electronic Components:
Customers 1,051,985 825,295 1,140,169 12,259,882
Intersegment 502,032 357,713 235,944 2,537,032
Total 1,554,017 1,183,008 1,376,113 14,796,914
Eliminations (502,614) (358,157) (237,268) (2,551,269)
Consolidated Net Sales ¥ 3,021,973 ¥ 2,455,850 ¥ 2,478,586 $ 26,651,462
Segment Income (Loss):
Consumer/Information Products ¥ 79,257 ¥ 51,008 ¥ 46,695 $ 502,097
Electronic Components 30,728 (54,699) (159,007) (1,709,753)
Adjustments (31,089) (33,861) (33,954) (365,097)
Consolidated Operating (Loss) Income ¥ 78,896 ¥ (37,552) ¥ (146,266) $ (1,572,753)
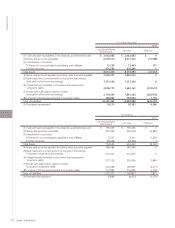
Segment Assets:
Consumer/Information Products ¥ 677,100 ¥ 632,365 ¥ 599,676 $ 6,448,129
Electronic Components 1,484,799 1,424,434 1,025,230 11,023,979
Adjustments 723,779 557,336 462,857 4,976,957
Consolidated Assets ¥ 2,885,678 ¥ 2,614,135 ¥ 2,087,763 $ 22,449,065
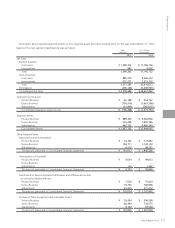
Other Material Items
Depreciation and Amortization:
Consumer/Information Products ¥ 82,276 ¥ 73,497 ¥ 64,747 $ 696,204
Electronic Components 190,963 166,030 111,747 1,201,581
Adjustments 8,025 7,563 4,518 48,581
The amount presented in Consolidated Financial Statements ¥ 281,264 ¥ 247,090 ¥ 181,012 $ 1,946,366
Amortization of Goodwill:
Consumer/Information Products ¥ 3,033 ¥ 3,336 ¥ 2,826 $ 30,387
Electronic Components 432 1,730 1,788 19,226
Adjustments 85 121 116 1,247
The amount presented in Consolidated Financial Statements ¥ 3,550 ¥ 5,187 ¥ 4,730 $ 50,860
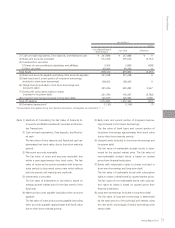
Investments in Nonconsolidated Subsidiaries and Affiliates accounted
for using the equity methods:
Consumer/Information Products ¥ 3,252 ¥ 3,340 ¥ 3,389 $ 36,440
Electronic Components 7,716 7,969 74,400 800,000
Adjustments 21,877 22,807 25,245 271,452
The amount presented in Consolidated Financial Statements ¥ 32,845 ¥ 34,116 ¥ 103,034 $ 1,107,892
Increase in Plant, Equipment and Intangible Assets:
Consumer/Information Products ¥ 76,861 ¥ 67,309 ¥ 52,295 $ 562,312
Electronic Components 159,220 123,904 69,568 748,043
Adjustments 14,900 13,493 8,142 87,548
The amount presented in Consolidated Financial Statements ¥ 250,981 ¥ 204,706 ¥ 130,005 $ 1,397,903
Financial Section