Sharp 2013 Annual Report Download - page 3
Download and view the complete annual report
Please find page 3 of the 2013 Sharp annual report below. You can navigate through the pages in the report by either clicking on the pages listed below, or by using the keyword search tool below to find specific information within the annual report.-
 1
1 -
 2
2 -
 3
3 -
 4
4 -
 5
5 -
 6
6 -
 7
7 -
 8
8 -
 9
9 -
 10
10 -
 11
11 -
 12
12 -
 13
13 -
 14
14 -
15
-
16
-
17
-
18
-
19
-
20
-
21
-
22
-
23
-
24
-
25
-
26
-
27
-
28
-
29
-
30
-
31
-
32
-
33
-
34
-
35
-
36
-
37
-
38
-
39
-
40
-
41
-
42
-
43
-
44
-
45
-
46
-
47
-
48
-
49
-
50
-
51
-
52
-
53
-
54
-
55
-
56
-
57
-
58
-
59
-
60
-
61
-
62
-
63
-
64
-
65
-
66
-
67
-
68
-
69
-
70
-
71
-
72
-
73
 |
 |

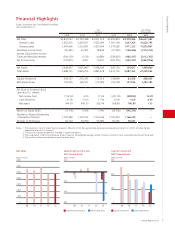
Annual Report 2013 1
売上高 設備投資
研究開発費
設備投資 研究開発費
Net Sales Capital Investment
R&D Expenditures
営業利益(損失)
当期純利益(損失)
営業利益(損失) 当期純利益(損失)
(十億円)(十億円) (十億円)
Operating Income (Loss)
Net Income (Loss)
Operating income (loss) Net income (loss) Capital investment R&D expenditures
(billions of yen)
09 10 11 12 13
-600
0
-200
-400
200
0
3,500
3,000
2,500
2,000
1,500
1,000
500
(billions of yen)
09 10 11 12 13
0
200
100
(billions of yen)
09 10 11 12 13
300
Notes: 1. The translation into U.S. dollar figures is based on ¥93=U.S.$1.00, the approximate exchange rate prevailing on March 31, 2013. All dollar figures
hereinafter refer to U.S. currency.
2. The amount of leased properties is included in capital investment.
3. The computation of net income (loss) per share is based on the weighted average number of shares of common stock outstanding during each fiscal year.
4. The number of shares outstanding is net of treasury stock.
Yen
(millions)
U.S. Dollars
(thousands)
2009 2010 2011 2012 2013 2013
Net Sales ¥2,847,227 ¥2,755,948 ¥3,021,973 ¥2,455,850 ¥2,478,586 $26,651,462
Domestic sales 1,302,261 1,429,057 1,592,909 1,181,168 1,007,264 10,830,795
Overseas sales 1,544,966 1,326,891 1,429,064 1,274,682 1,471,322 15,820,667
Operating Income (Loss) (55,481) 51,903 78,896 (37,552) (146,266) (1,572,753)
Income (Loss) before Income
Taxes and Minority Interests (204,139) 6,139 40,880 (238,429) (466,187) (5,012,763)
Net Income (Loss) (125,815) 4,397 19,401 (376,076) (545,347) (5,863,946)
Net Assets 1,048,447 1,065,860 1,048,645 645,120 134,837 1,449,860
Total Assets 2,688,721 2,836,255 2,885,678 2,614,135 2,087,763 22,449,065
Capital Investment 260,337 215,781 172,553 118,899 82,458 886,645
R&D Expenditures 195,525 166,507 173,983 154,798 137,936 1,483,183
Per Share of Common Stock
(yen and U.S. dollars)
Net income (loss) (114.33) 4.00 17.63 (341.78) (489.83) (5.27)
Cash dividends 21.00 17.00 17.00 10.00 0.00 0.00
Net assets 944.24 949.19 932.46 568.83 106.90 1.15
Return on Equity (ROE) (11.1%) 0.4% 1.9% (45.5%) (145.3%) —
Number of Shares Outstanding
(thousands of shares) 1,100,480 1,100,414 1,100,346 1,100,324 1,166,224 —
Number of Employees 54,144 53,999 55,580 56,756 50,647 —
Financial Highlights
Financial Highlights
Sharp Corporation and Consolidated Subsidiaries
Years Ended March 31