Salesforce.com 2013 Annual Report Download - page 95
Download and view the complete annual report
Please find page 95 of the 2013 Salesforce.com annual report below. You can navigate through the pages in the report by either clicking on the pages listed below, or by using the keyword search tool below to find specific information within the annual report.-
 1
1 -
2
-
3
-
4
-
5
-
6
-
7
-
8
-
9
-
10
-
11
-
12
-
13
-
14
-
15
-
16
-
17
-
18
-
19
-
20
-
21
-
22
-
23
-
24
-
25
-
26
-
27
-
28
-
29
-
30
-
31
-
32
-
33
-
34
-
35
-
36
-
37
-
38
-
39
-
40
-
41
-
42
-
43
-
44
-
45
-
46
-
47
-
48
-
49
-
50
-
51
-
52
-
53
-
54
-
55
-
56
-
57
-
58
-
59
-
60
-
61
-
62
-
63
-
64
-
65
-
66
-
67
-
68
-
69
-
70
-
71
-
72
-
73
-
74
-
75
-
76
-
77
-
78
-
79
-
80
-
81
-
82
-
83
-
84
-
 85
85 -
 86
86 -
 87
87 -
 88
88 -
 89
89 -
 90
90 -
 91
91 -
 92
92 -
 93
93 -
 94
94 -
 95
95 -
 96
96 -
 97
97 -
 98
98 -
 99
99 -
 100
100 -
 101
101 -
 102
102 -
 103
103 -
 104
104 -
 105
105 -
106
-
107
-
108
-
109
-
110
-
111
-
112
-
113
-
114
-
115
-
116
-
117
-
118
-
119
-
120
 |
 |

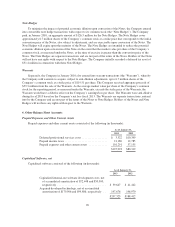
Capitalized internal-use software amortization expense totaled $22.1 million, $15.8 million and
$13.1 million for fiscal 2013, 2012 and 2011, respectively. Acquired developed technology amortization expense
totaled $80.0 million, $62.1 million, and $16.9 million for fiscal 2013, 2012 and 2011, respectively.
During fiscal 2013, 2012 and 2011, the Company capitalized $3.4 million, $2.4 million and $2.6 million
respectively, of stock-based expenses related to capitalized internal-use software development and deferred
professional services.
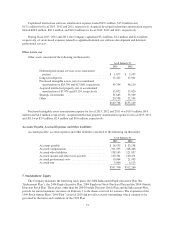
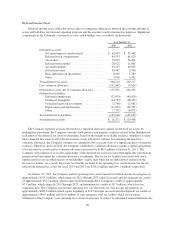
Other Assets, net
Other assets consisted of the following (in thousands):
As of January 31,
2013 2012
Deferred professional services costs, noncurrent
portion ...................................... $ 1,077 $ 3,935
Long-term deposits .............................. 13,422 13,941
Purchased intangible assets, net of accumulated
amortization of $28,790 and $17,868, respectively . . . 49,354 46,110
Acquired intellectual property, net of accumulated
amortization of $7,074 and $3,139, respectively ..... 13,872 15,020
Strategic investments ............................ 51,685 53,949
Other ......................................... 20,338 22,194
$149,748 $155,149
Purchased intangible assets amortization expense for fiscal 2013, 2012 and 2011 was $10.9 million, $8.0
million and $4.2 million, respectively. Acquired intellectual property amortization expense for fiscal 2013, 2012
and 2011 was $3.9 million, $2.4 million and $0.6 million, respectively.
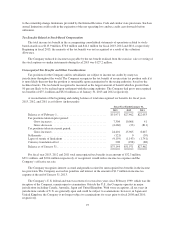
Accounts Payable, Accrued Expenses and Other Liabilities
Accounts payable, accrued expenses and other liabilities consisted of the following (in thousands):
As of January 31,
2013 2012
Accounts payable ............................... $ 14,535 $ 33,258
Accrued compensation ........................... 311,595 228,466
Accrued other liabilities .......................... 138,165 121,957
Accrued income and other taxes payable ............. 120,341 100,471
Accrued professional costs ........................ 10,064 21,993
Accrued rent ................................... 3,006 6,115
$597,706 $512,260
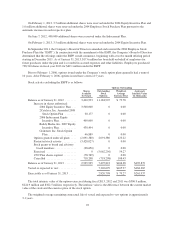
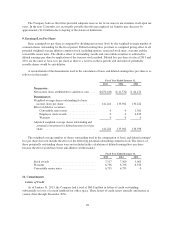
7. Stockholders’ Equity
The Company maintains the following stock plans: the 2006 Inducement Equity Incentive Plan (the
“Inducement Plan”), the 2004 Equity Incentive Plan, 2004 Employee Stock Purchase Plan and the 2004 Outside
Directors Stock Plan. These plans, other than the 2004 Outside Directors Stock Plan and the Inducement Plan,
provide for annual automatic increases on February 1 to the shares reserved for issuance. The expiration of the
1999 Stock Option Plan (“1999 Plan”) in fiscal 2010 did not affect awards outstanding, which continue to be
governed by the terms and conditions of the 1999 Plan.
91