Salesforce.com 2013 Annual Report Download - page 53
Download and view the complete annual report
Please find page 53 of the 2013 Salesforce.com annual report below. You can navigate through the pages in the report by either clicking on the pages listed below, or by using the keyword search tool below to find specific information within the annual report.-
 1
1 -
2
-
3
-
4
-
5
-
6
-
7
-
8
-
9
-
10
-
11
-
12
-
13
-
14
-
15
-
16
-
17
-
18
-
19
-
20
-
21
-
22
-
23
-
24
-
25
-
26
-
27
-
28
-
29
-
30
-
31
-
32
-
33
-
34
-
35
-
36
-
37
-
38
-
39
-
40
-
41
-
42
-
 43
43 -
 44
44 -
 45
45 -
 46
46 -
 47
47 -
 48
48 -
 49
49 -
 50
50 -
 51
51 -
 52
52 -
 53
53 -
 54
54 -
 55
55 -
 56
56 -
 57
57 -
 58
58 -
 59
59 -
 60
60 -
 61
61 -
 62
62 -
 63
63 -
64
-
65
-
66
-
67
-
68
-
69
-
70
-
71
-
72
-
73
-
74
-
75
-
76
-
77
-
78
-
79
-
80
-
81
-
82
-
83
-
84
-
85
-
86
-
87
-
88
-
89
-
90
-
91
-
92
-
93
-
94
-
95
-
96
-
97
-
98
-
99
-
100
-
101
-
102
-
103
-
104
-
105
-
106
-
107
-
108
-
109
-
110
-
111
-
112
-
113
-
114
-
115
-
116
-
117
-
118
-
119
-
120
 |
 |

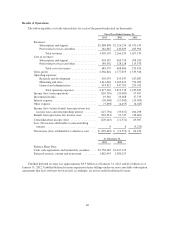
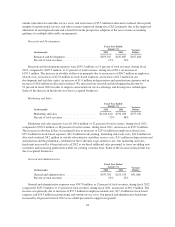
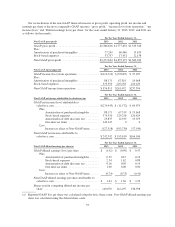
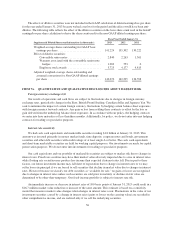
Income (loss) from operations.
Fiscal Year Ended
January 31, Variance
Dollars(In thousands) 2012 2011
Income (loss) from operations .................... $(35,085) $97,497 $(132,582)
Percent of total revenues ........................ (2)% 6%
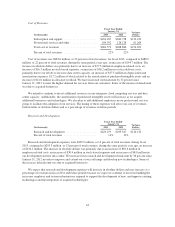
Loss from operations during fiscal 2012 was $35.1 million and included $229.3 million of stock-based
expenses and $67.3 million of amortization of purchased intangibles. During fiscal 2011, operating income was
$97.5 million and included $120.4 million of stock-based expenses and $19.7 million of amortization of
purchased intangibles.
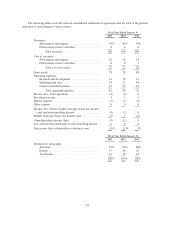
Investment income.
Fiscal Year Ended
January 31, Variance
Dollars(In thousands) 2012 2011
Investment income .............................. $23,268 $37,735 $(14,467)
Percent of total revenues .......................... 1% 2%
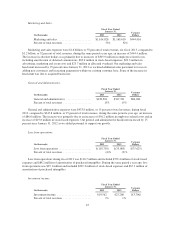
Investment income consists of income on cash and marketable securities balances. Investment income was
$23.3 million during fiscal 2012 and was $37.7 million during fiscal 2011. The decrease was primarily due to a
reduction in realized gains from sales of marketable securities, the decrease in marketable securities balances and
lower interest rates.
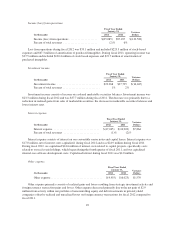
Interest expense.
Fiscal Year Ended
January 31, Variance
Dollars(In thousands) 2012 2011
Interest expense ................................ $(17,045) $(24,909) $7,864
Percent of total revenues ......................... (1)% (2)%
Interest expense consists of interest on our convertible senior notes and capital leases. Interest expense was
$17.0 million, net of interest costs capitalized, during fiscal 2012 and was $24.9 million during fiscal 2011.
During fiscal 2012, we capitalized $14.6 million of interest costs related to capital projects, specifically costs
related to our real estate holdings, which began during the fourth quarter of fiscal 2011, and our capitalized
internal-use software development costs. Capitalized interest during fiscal 2011 was $4.0 million.
Other expense.
Fiscal Year Ended
January 31, Variance
Dollars(In thousands) 2012 2011
Other expense .................................... $(4,455) $(6,025) $1,570
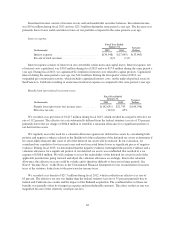
Other expense primarily consists of realized gains and losses resulting from strategic investment activity and
foreign currency transaction gains and losses. Other expense decreased primarily due to the net gain of $2.9
million from activity within our portfolio of noncontrolling equity and debt investments in privately-held
companies offset by realized and unrealized losses on foreign currency transactions for fiscal 2012 compared to
fiscal 2011.
49