Salesforce.com 2013 Annual Report Download - page 54
Download and view the complete annual report
Please find page 54 of the 2013 Salesforce.com annual report below. You can navigate through the pages in the report by either clicking on the pages listed below, or by using the keyword search tool below to find specific information within the annual report.-
 1
1 -
2
-
3
-
4
-
5
-
6
-
7
-
8
-
9
-
10
-
11
-
12
-
13
-
14
-
15
-
16
-
17
-
18
-
19
-
20
-
21
-
22
-
23
-
24
-
25
-
26
-
27
-
28
-
29
-
30
-
31
-
32
-
33
-
34
-
35
-
36
-
37
-
38
-
39
-
40
-
41
-
42
-
43
-
 44
44 -
 45
45 -
 46
46 -
 47
47 -
 48
48 -
 49
49 -
 50
50 -
 51
51 -
 52
52 -
 53
53 -
 54
54 -
 55
55 -
 56
56 -
 57
57 -
 58
58 -
 59
59 -
 60
60 -
 61
61 -
 62
62 -
 63
63 -
 64
64 -
65
-
66
-
67
-
68
-
69
-
70
-
71
-
72
-
73
-
74
-
75
-
76
-
77
-
78
-
79
-
80
-
81
-
82
-
83
-
84
-
85
-
86
-
87
-
88
-
89
-
90
-
91
-
92
-
93
-
94
-
95
-
96
-
97
-
98
-
99
-
100
-
101
-
102
-
103
-
104
-
105
-
106
-
107
-
108
-
109
-
110
-
111
-
112
-
113
-
114
-
115
-
116
-
117
-
118
-
119
-
120
 |
 |

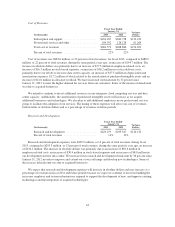
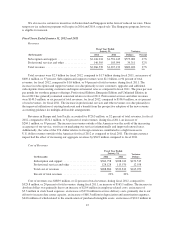
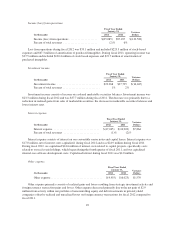
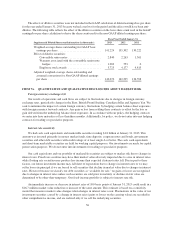
Benefit from (provision for) income taxes.
Fiscal Year Ended
January 31, Variance
Dollars(In thousands) 2012 2011
Benefit (provision) for income taxes ................ $21,745 $(34,601) $56,346
Effective tax rate ................................ 65% 33%
The benefit for income taxes was $21.7 million during fiscal 2012, compared to an income tax provision of
$34.6 million during fiscal 2011.
Our effective tax rate was 65 percent for fiscal 2012 compared to 33 percent for fiscal 2011. The higher tax
rate was primarily attributable to an increase in federal and California tax credits and a tax benefit related to the
May 2011 acquisition of Radian6. The combined effect of these tax benefits was partially offset by an increase in
the foreign tax rate differential. Foreign tax expense relative to our fiscal 2012 pre-tax loss was higher as
compared to foreign tax expense relative to our fiscal 2011 pre-tax income. The combined effect of these items
on a small net loss before income taxes resulted in a comparatively higher fiscal 2012 effective tax rate.
The lower fiscal 2012 state tax rate was primarily attributable to two items. First, California enacted several
income tax law changes, which generally benefited California-based companies. The result of this tax law change
substantially reduced our state effective tax rate. Second, the Company was subject to minimum state taxes,
which reduced the state tax benefit. The combined effect of these tax items was an overall small fiscal 2012 state
tax benefit. Note that we separately recorded an income tax expense of $2.2 million in fiscal 2011 to re-value the
anticipated future tax effects of our California temporary differences related to this tax law change.
We also receive certain tax incentives in Switzerland and Singapore in the form of reduced tax rates. These
temporary tax reduction programs will expire in 2016 and 2014, respectively. The Singapore program, however,
is eligible for renewal.
New Accounting Pronouncement
In July 2012, the FASB issued Accounting Standards Update No. 2012-02, Intangibles—Goodwill and
Other (Topic 350)—Testing Indefinite-Lived Intangible Assets for Impairment (ASU 2012-02), to allow entities
to use a qualitative approach to test indefinite-lived intangible assets for impairment. ASU 2012-02 permits an
entity to first perform a qualitative assessment to determine whether it is more likely than not that the fair value
of an indefinite-lived intangible asset is less than its carrying value. If it is concluded that this is the case, it is
necessary to perform the currently prescribed quantitative impairment test by comparing the fair value of the
indefinite-lived intangible asset with its carrying value. Otherwise, the quantitative impairment test is not
required. We plan to adopt ASU 2012-02 in fiscal 2014 and do not believe that the adoption will have a material
effect on the consolidated financial statements.
Liquidity and Capital Resources
At January 31, 2013, our principal sources of liquidity were cash, cash equivalents and marketable securities
totaling $1.8 billion and accounts receivable of $872.6 million.
Net cash provided by operating activities was $736.9 million during fiscal 2013 and $591.5 million during
the same period a year ago. Cash provided by operating activities has historically been affected by: the amount of
net loss adjusted for non-cash expense items such as depreciation and amortization, amortization of purchased
intangibles from business combinations, amortization of debt discount, and the expense associated with stock-
based awards; the reclassification of excess tax benefits from employee stock plans to cash flows from financing
activities; the timing of employee related costs including commissions and bonus payments; the timing of
collections from our customers, which is our largest source of operating cash flows; and changes in working
capital accounts.
50