Salesforce.com 2013 Annual Report Download - page 68
Download and view the complete annual report
Please find page 68 of the 2013 Salesforce.com annual report below. You can navigate through the pages in the report by either clicking on the pages listed below, or by using the keyword search tool below to find specific information within the annual report.-
 1
1 -
2
-
3
-
4
-
5
-
6
-
7
-
8
-
9
-
10
-
11
-
12
-
13
-
14
-
15
-
16
-
17
-
18
-
19
-
20
-
21
-
22
-
23
-
24
-
25
-
26
-
27
-
28
-
29
-
30
-
31
-
32
-
33
-
34
-
35
-
36
-
37
-
38
-
39
-
40
-
41
-
42
-
43
-
44
-
45
-
46
-
47
-
48
-
49
-
50
-
51
-
52
-
53
-
54
-
55
-
56
-
57
-
 58
58 -
 59
59 -
 60
60 -
 61
61 -
 62
62 -
 63
63 -
 64
64 -
 65
65 -
 66
66 -
 67
67 -
 68
68 -
 69
69 -
 70
70 -
 71
71 -
 72
72 -
 73
73 -
 74
74 -
 75
75 -
 76
76 -
 77
77 -
 78
78 -
79
-
80
-
81
-
82
-
83
-
84
-
85
-
86
-
87
-
88
-
89
-
90
-
91
-
92
-
93
-
94
-
95
-
96
-
97
-
98
-
99
-
100
-
101
-
102
-
103
-
104
-
105
-
106
-
107
-
108
-
109
-
110
-
111
-
112
-
113
-
114
-
115
-
116
-
117
-
118
-
119
-
120
 |
 |

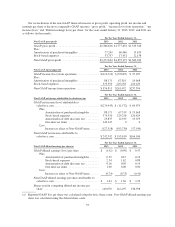
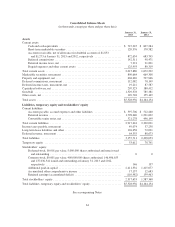
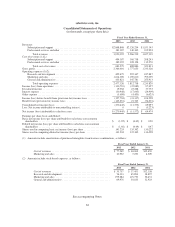
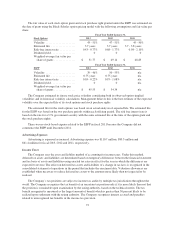
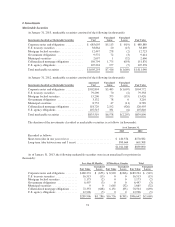
salesforce.com, inc.
Consolidated Statements of Stockholders’ Equity
(in thousands, except share data)
Common Stock Additional
Paid-in
Capital
Accumulated
Other
Comprehensive
Income/(Loss)
Retained
Earnings
(Accumulated
Deficit)
Total
Stockholders’
Equity
Controlling
Interest
Total
Stockholders’
Equity
Noncontrolling
Interest
Total
Stockholders’
EquityShares Amount
Balances at January 31, 2010 ..........127,152,449 $127 $ 938,544 $ (1,430) $ 106,561 $1,043,802 $ 12,864 $1,056,666
Exercise of stock options and stock
grants to board members for board
services ..................... 4,697,518 5 165,494 0 0 165,499 0 165,499
Vested restricted stock units
converted to shares ............ 1,071,180 1 0 0 0 1 0 1
Tax benefits from employee stock
plans ....................... 0 0 36,069 0 0 36,069 0 36,069
Stock-based expenses ............ 0 0 115,139 0 0 115,139 0 115,139
Purchase of subsidiary stock, net . . . 0 0 (156,187) 0 0 (156,187) 0 (156,187)
Other ......................... 0 0 (455) 0 0 (455) 0 (455)
Noncontrolling interest ........... 0 0 0 0 0 0 (12,864) (12,864)
Other comprehensive income
attributable to salesforce.com, net
oftax ....................... 0 0 0 8,149 0 8,149 0 8,149
Net income attributable to
salesforce.com ................ 0 0 0 0 64,474 64,474 0 64,474
Balances at January 31, 2011 ..........132,921,147 $133 $1,098,604 $ 6,719 $ 171,035 $1,276,491 $ 0 $1,276,491
Exercise of stock options and stock
grants to board members for board
services ..................... 2,517,431 3 111,779 0 0 111,782 0 111,782
Vested restricted stock units
converted to shares ............ 1,075,001 1 0 0 0 1 0 1
Shares issued related to business
combinations ................. 522,962 0 56,612 0 0 56,612 0 56,612
Tax benefits from employee stock
plans ....................... 0 0 1,611 0 0 1,611 0 1,611
Stock-based expenses ............ 0 0 225,212 0 0 225,212 0 225,212
Temporary equity reclassification . . 0 0 (78,741) 0 0 (78,741) 0 (78,741)
Other comprehensive income
attributable to salesforce.com, net
oftax ....................... 0 0 0 5,964 0 5,964 0 5,964
Net loss attributable to
salesforce.com ................ 0 0 0 0 (11,572) (11,572) 0 (11,572)
Balances at January 31, 2012 ..........137,036,541 $137 $1,415,077 $12,683 $ 159,463 $1,587,360 $ 0 $1,587,360
Exercise of stock options and stock
grants to board members for board
services ..................... 5,059,245 5 279,003 0 0 279,008 0 279,008
Vested restricted stock units
converted to shares ............ 1,640,885 2 0 0 0 2 0 2
Shares issued related to business
combinations ................. 1,931,674 2 240,026 0 0 240,028 0 240,028
Shares issued under employee stock
plans ....................... 738,310 0 69,067 0 0 69,067 0 69,067
Tax benefits from employee stock
plans ....................... 0 0 7,189 0 0 7,189 0 7,189
Stock-based expenses ............ 0 0 375,841 0 0 375,841 0 375,841
Temporary equity reclassification . . 0 0 25,129 0 0 25,129 0 25,129
Other comprehensive income
attributable to salesforce.com, net
oftax ....................... 0 0 0 4,454 0 4,454 0 4,454
Net loss attributable to
salesforce.com ................ 0 0 0 0 (270,445) (270,445) 0 (270,445)
Balances at January 31, 2013 ..........146,406,655 $146 $2,411,332 $17,137 $(110,982) $2,317,633 $ 0 $2,317,633
See accompanying Notes.
64