Salesforce.com 2013 Annual Report Download - page 82
Download and view the complete annual report
Please find page 82 of the 2013 Salesforce.com annual report below. You can navigate through the pages in the report by either clicking on the pages listed below, or by using the keyword search tool below to find specific information within the annual report.-
 1
1 -
2
-
3
-
4
-
5
-
6
-
7
-
8
-
9
-
10
-
11
-
12
-
13
-
14
-
15
-
16
-
17
-
18
-
19
-
20
-
21
-
22
-
23
-
24
-
25
-
26
-
27
-
28
-
29
-
30
-
31
-
32
-
33
-
34
-
35
-
36
-
37
-
38
-
39
-
40
-
41
-
42
-
43
-
44
-
45
-
46
-
47
-
48
-
49
-
50
-
51
-
52
-
53
-
54
-
55
-
56
-
57
-
58
-
59
-
60
-
61
-
62
-
63
-
64
-
65
-
66
-
67
-
68
-
69
-
70
-
71
-
 72
72 -
 73
73 -
 74
74 -
 75
75 -
 76
76 -
 77
77 -
 78
78 -
 79
79 -
 80
80 -
 81
81 -
 82
82 -
 83
83 -
 84
84 -
 85
85 -
 86
86 -
 87
87 -
 88
88 -
 89
89 -
 90
90 -
 91
91 -
 92
92 -
93
-
94
-
95
-
96
-
97
-
98
-
99
-
100
-
101
-
102
-
103
-
104
-
105
-
106
-
107
-
108
-
109
-
110
-
111
-
112
-
113
-
114
-
115
-
116
-
117
-
118
-
119
-
120
 |
 |

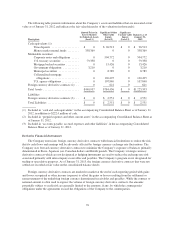
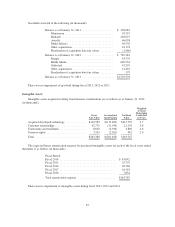
Investment Income
Investment income consists of interest income, realized gains, and realized losses on the Company’s cash,
cash equivalents and marketable securities. The components of investment income are presented below (in
thousands):
Fiscal Year Ended January 31,
2013 2012 2011
Interest income .................................. $17,903 $20,791 $28,273
Realized gains ................................... 5,007 6,542 12,460
Realized losses .................................. (3,348) (4,065) (2,998)
Total investment income ........................... $19,562 $23,268 $37,735
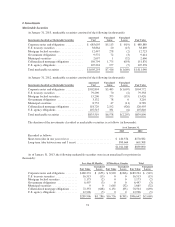
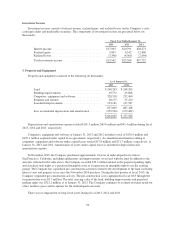
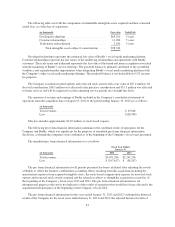
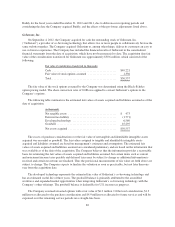
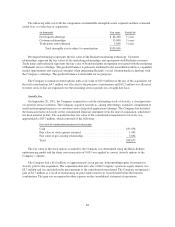
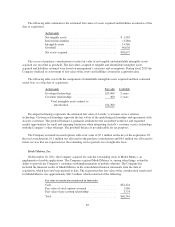
3. Property and Equipment
Property and equipment consisted of the following (in thousands):
As of January 31,
2013 2012
Land .......................................... $248,263 $ 248,263
Building improvements ........................... 49,572 43,868
Computers, equipment and software ................. 328,318 232,460
Furniture and fixtures ............................. 38,275 25,250
Leasehold improvements .......................... 193,181 137,587
857,609 687,428
Less accumulated depreciation and amortization ........ (252,940) (159,482)
$ 604,669 $ 527,946
Depreciation and amortization expense totaled $101.1 million, $69.8 million and $41.4 million during fiscal
2013, 2012 and 2011, respectively.
Computers, equipment and software at January 31, 2013 and 2012 included a total of $136.9 million and
$105.1 million acquired under capital lease agreements, respectively. Accumulated amortization relating to
computers, equipment and software under capital leases totaled $57.8 million and $31.7 million, respectively, at
January 31, 2013 and 2012. Amortization of assets under capital leases is included in depreciation and
amortization expense.
In November 2010, the Company purchased approximately 14 acres of undeveloped real estate in
San Francisco, California, including entitlements and improvements associated with the land. In addition to the
amounts reflected in the table above, the Company recorded $23.3 million related to the perpetual parking rights
and classified such rights as a purchased intangible asset as it represents an intangible right to use the existing
garage. The Company has capitalized pre-construction activities related to the development of the land, including
interest costs and property taxes since the November 2010 purchase. During the first quarter of fiscal 2013, the
Company suspended pre-construction activity. The pre-construction costs capitalized in fiscal 2013 through the
suspension date were $5.7 million. The total carrying value of the land, building improvements and perpetual
parking rights was $321.1 million as of January 31, 2013. The Company continues to evaluate its future needs for
office facilities space and its options for the undeveloped real estate.
There was no impairment of long-lived assets during fiscal 2013, 2012 and 2011.
78