Salesforce.com 2013 Annual Report Download - page 59
Download and view the complete annual report
Please find page 59 of the 2013 Salesforce.com annual report below. You can navigate through the pages in the report by either clicking on the pages listed below, or by using the keyword search tool below to find specific information within the annual report.-
 1
1 -
2
-
3
-
4
-
5
-
6
-
7
-
8
-
9
-
10
-
11
-
12
-
13
-
14
-
15
-
16
-
17
-
18
-
19
-
20
-
21
-
22
-
23
-
24
-
25
-
26
-
27
-
28
-
29
-
30
-
31
-
32
-
33
-
34
-
35
-
36
-
37
-
38
-
39
-
40
-
41
-
42
-
43
-
44
-
45
-
46
-
47
-
48
-
 49
49 -
 50
50 -
 51
51 -
 52
52 -
 53
53 -
 54
54 -
 55
55 -
 56
56 -
 57
57 -
 58
58 -
 59
59 -
 60
60 -
 61
61 -
 62
62 -
 63
63 -
 64
64 -
 65
65 -
 66
66 -
 67
67 -
 68
68 -
 69
69 -
70
-
71
-
72
-
73
-
74
-
75
-
76
-
77
-
78
-
79
-
80
-
81
-
82
-
83
-
84
-
85
-
86
-
87
-
88
-
89
-
90
-
91
-
92
-
93
-
94
-
95
-
96
-
97
-
98
-
99
-
100
-
101
-
102
-
103
-
104
-
105
-
106
-
107
-
108
-
109
-
110
-
111
-
112
-
113
-
114
-
115
-
116
-
117
-
118
-
119
-
120
 |
 |

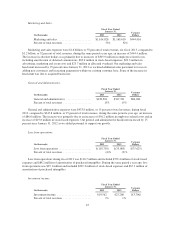
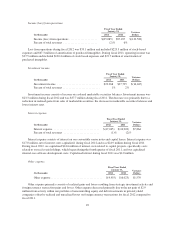
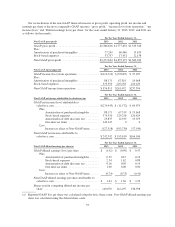
Our reconciliation of the non-GAAP financial measure of gross profit, operating profit, net income and
earnings per share to the most comparable GAAP measure, “gross profit,” “income (loss) from operations,” “net
income (loss)” and “Diluted earnings (loss) per share” for the years ended January 31, 2013, 2012, and 2011 are
as follows (in thousands):
For the Year Ended January 31,
Non-GAAP gross profit 2013 2012 2011
GAAP gross profit .............................. $2,366,616 $1,777,653 $1,333,326
Plus:
Amortization of purchased intangibles .............. 77,249 60,069 15,459
Stock-based expenses ........................... 33,757 17,451 12,158
Non-GAAP gross profit ......................... $2,477,622 $1,855,173 $1,360,943
For the Year Ended January 31,
Non-GAAP operating profit 2013 2012 2011
GAAP income (loss) from operations ............... $(110,710) $ (35,085) $ 97,497
Plus:
Amortization of purchased intangibles .............. 88,171 67,319 19,668
Stock-based expenses ........................... 379,350 229,258 120,429
Non-GAAP income from operations ................ $356,811 $261,492 $237,594
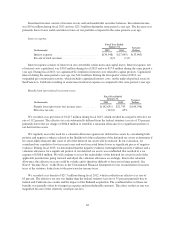
For the Year Ended January 31,
Non-GAAP net income attributable to salesforce.com 2013 2012 2011
GAAP net income (loss) attributable to
salesforce.com ............................... $(270,445) $ (11,572) $ 64,474
Plus:
Amortization of purchased intangibles ...... 88,171 67,319 $ 19,668
Stock-based expenses ................... 379,350 229,258 120,429
Amortization of debt discount, net ......... 23,837 12,335 19,079
One-time tax items ..................... 149,147 0 0
Less:
Income tax effect of Non-GAAP items ...... (127,518) (103,730) (57,544)
Non-GAAP net income attributable to
salesforce.com ............................... $242,542 $ 193,610 $166,106
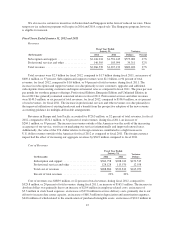
For the Year Ended January 31,
Non-GAAP diluted earnings per share(a) 2013 2012 2011
GAAP diluted earnings (loss) per share ............. $ (1.92) $ (0.09) $ 0.47
Plus:
Amortization of purchased intangibles ...... 0.59 0.47 0.14
Stock-based expenses ................... 2.54 1.62 0.88
Amortization of debt discount, net ......... 0.16 0.09 0.14
One-time tax items ..................... 1.00 0.00 0.00
Less:
Income tax effect of Non-GAAP items ...... (0.74) (0.73) (0.41)
Non-GAAP diluted earnings per share attributable to
salesforce.com ............................... $ 1.63 $ 1.36 $ 1.22
Shares used in computing diluted net income per
share ...................................... 149,070 142,295 136,598
(a) Reported GAAP loss per share was calculated using the basic share count. Non-GAAP diluted earnings per
share was calculated using the diluted share count.
55