Salesforce.com 2013 Annual Report Download - page 105
Download and view the complete annual report
Please find page 105 of the 2013 Salesforce.com annual report below. You can navigate through the pages in the report by either clicking on the pages listed below, or by using the keyword search tool below to find specific information within the annual report.-
 1
1 -
2
-
3
-
4
-
5
-
6
-
7
-
8
-
9
-
10
-
11
-
12
-
13
-
14
-
15
-
16
-
17
-
18
-
19
-
20
-
21
-
22
-
23
-
24
-
25
-
26
-
27
-
28
-
29
-
30
-
31
-
32
-
33
-
34
-
35
-
36
-
37
-
38
-
39
-
40
-
41
-
42
-
43
-
44
-
45
-
46
-
47
-
48
-
49
-
50
-
51
-
52
-
53
-
54
-
55
-
56
-
57
-
58
-
59
-
60
-
61
-
62
-
63
-
64
-
65
-
66
-
67
-
68
-
69
-
70
-
71
-
72
-
73
-
74
-
75
-
76
-
77
-
78
-
79
-
80
-
81
-
82
-
83
-
84
-
85
-
86
-
87
-
88
-
89
-
90
-
91
-
92
-
93
-
94
-
 95
95 -
 96
96 -
 97
97 -
 98
98 -
 99
99 -
 100
100 -
 101
101 -
 102
102 -
 103
103 -
 104
104 -
 105
105 -
 106
106 -
 107
107 -
 108
108 -
 109
109 -
 110
110 -
 111
111 -
 112
112 -
 113
113 -
 114
114 -
 115
115 -
116
-
117
-
118
-
119
-
120
 |
 |

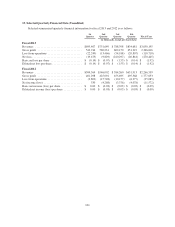
15. Selected Quarterly Financial Data (Unaudited)
Selected summarized quarterly financial information for fiscal 2013 and 2012 is as follows:
1st
Quarter
2nd
Quarter
3rd
Quarter
4th
Quarter Fiscal Year
(in thousands, except per share data)
Fiscal 2013
Revenues ................................. $695,467 $731,649 $ 788,398 $834,681 $3,050,195
Gross profit ............................... 543,916 569,231 602,150 651,319 2,366,616
Loss from operations ........................ (22,249) (13,466) (54,188) (20,807) (110,710)
Net loss ................................... (19,475) (9,829) (220,297) (20,844) (270,445)
Basic net loss per share ...................... $ (0.14) $ (0.07) $ (1.55) $ (0.14) $ (1.92)
Diluted net loss per share ..................... $ (0.14) $ (0.07) $ (1.55) $ (0.14) $ (1.92)
Fiscal 2012
Revenues ................................. $504,364 $546,002 $ 584,260 $631,913 $2,266,539
Gross profit ............................... 401,298 425,092 455,695 495,568 1,777,653
Loss from operations ........................ (2,803) (15,748) (10,157) (6,377) (35,085)
Net income (loss) ........................... 530 (4,268) (3,756) (4,078) (11,572)
Basic net income (loss) per share .............. $ 0.00 $ (0.03) $ (0.03) $ (0.03) $ (0.09)
Diluted net income (loss) per share ............. $ 0.00 $ (0.03) $ (0.03) $ (0.03) $ (0.09)
101