Salesforce.com 2013 Annual Report Download - page 47
Download and view the complete annual report
Please find page 47 of the 2013 Salesforce.com annual report below. You can navigate through the pages in the report by either clicking on the pages listed below, or by using the keyword search tool below to find specific information within the annual report.-
 1
1 -
2
-
3
-
4
-
5
-
6
-
7
-
8
-
9
-
10
-
11
-
12
-
13
-
14
-
15
-
16
-
17
-
18
-
19
-
20
-
21
-
22
-
23
-
24
-
25
-
26
-
27
-
28
-
29
-
30
-
31
-
32
-
33
-
34
-
35
-
36
-
 37
37 -
 38
38 -
 39
39 -
 40
40 -
 41
41 -
 42
42 -
 43
43 -
 44
44 -
 45
45 -
 46
46 -
 47
47 -
 48
48 -
 49
49 -
 50
50 -
 51
51 -
 52
52 -
 53
53 -
 54
54 -
 55
55 -
 56
56 -
 57
57 -
58
-
59
-
60
-
61
-
62
-
63
-
64
-
65
-
66
-
67
-
68
-
69
-
70
-
71
-
72
-
73
-
74
-
75
-
76
-
77
-
78
-
79
-
80
-
81
-
82
-
83
-
84
-
85
-
86
-
87
-
88
-
89
-
90
-
91
-
92
-
93
-
94
-
95
-
96
-
97
-
98
-
99
-
100
-
101
-
102
-
103
-
104
-
105
-
106
-
107
-
108
-
109
-
110
-
111
-
112
-
113
-
114
-
115
-
116
-
117
-
118
-
119
-
120
 |
 |

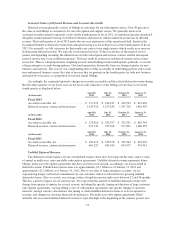
Fiscal Year Ended January 31,
2013 2012 2011
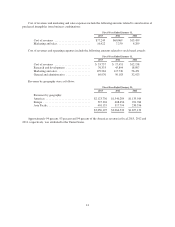
Amortization of purchased intangibles from business
combinations:
Cost of revenues ............................. 3% 3% 1%
Marketing and sales .......................... 0 0 0
Fiscal Year Ended January 31,
2013 2012 2011
Stock-based awards:
Cost of revenues ............................. 1% 1% 1%
Research and development ..................... 3 2 1
Marketing and sales .......................... 7 5 3
General and administrative ..................... 2 2 2
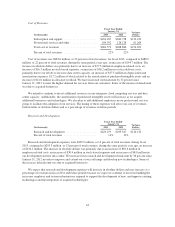
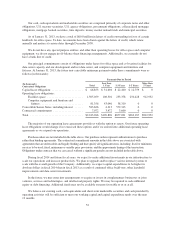
Fiscal Years Ended January 31, 2013 and 2012
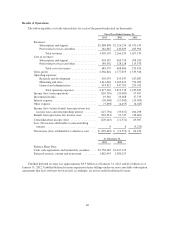
Revenues.
Fiscal Year Ended January 31, Variance
(In thousands) 2013 2012 Dollars Percent
Subscription and support ................. $2,868,808 $2,126,234 $742,574 35%
Professional services and other ............ 181,387 140,305 41,082 29%
Total revenues ......................... $3,050,195 $2,266,539 $783,656 35%
Total revenues were $3.1 billion for fiscal 2013, compared to $2.3 billion during the same period a year ago,
an increase of $783.7 million, or 35 percent. Subscription and support revenues were $2.9 billion, or 94 percent
of total revenues, for fiscal 2013, compared to $2.1 billion, or 94 percent of total revenues, during the same
period a year ago. The increase in subscription and support revenues was due primarily to new customers,
upgrades and additional subscriptions from existing customers and improved renewal rates as compared to a year
ago. During fiscal 2013, we continued to invest in a variety of customer programs and initiatives which, along
with longer contract durations and increasing enterprise adoption, have helped improve our renewal rates. The
price per user per month for our three primary offerings, Professional Edition, Enterprise Edition and Unlimited
Edition, in fiscal 2013 has generally remained consistent relative to prior periods. Professional services and other
revenues were $181.4 million, or six percent of total revenues, for fiscal 2013, compared to $140.3 million, or six
percent of total revenues, for the same period a year ago. The increase in professional services and other revenues
was due primarily to the higher demand for services from an increased number of customers.
Revenues in Europe and Asia Pacific accounted for $926.5 million, or 30 percent of total revenues, for fiscal
2013, compared to $726.3 million, or 32 percent of total revenues, during the same period a year ago, an increase
of $200.2 million, or 28 percent. The increase in revenues outside of the Americas was the result of the
increasing acceptance of our service, our focus on marketing our services internationally and improved renewal
rates as a result of the reasons stated above. Revenues outside of the Americas increased despite an overall
strengthening of the U.S. dollar relative to major international currencies, which reduced aggregate international
revenues by $43.9 million compared to the same period a year ago.
43