Salesforce.com 2013 Annual Report Download - page 52
Download and view the complete annual report
Please find page 52 of the 2013 Salesforce.com annual report below. You can navigate through the pages in the report by either clicking on the pages listed below, or by using the keyword search tool below to find specific information within the annual report.-
 1
1 -
2
-
3
-
4
-
5
-
6
-
7
-
8
-
9
-
10
-
11
-
12
-
13
-
14
-
15
-
16
-
17
-
18
-
19
-
20
-
21
-
22
-
23
-
24
-
25
-
26
-
27
-
28
-
29
-
30
-
31
-
32
-
33
-
34
-
35
-
36
-
37
-
38
-
39
-
40
-
41
-
 42
42 -
 43
43 -
 44
44 -
 45
45 -
 46
46 -
 47
47 -
 48
48 -
 49
49 -
 50
50 -
 51
51 -
 52
52 -
 53
53 -
 54
54 -
 55
55 -
 56
56 -
 57
57 -
 58
58 -
 59
59 -
 60
60 -
 61
61 -
 62
62 -
63
-
64
-
65
-
66
-
67
-
68
-
69
-
70
-
71
-
72
-
73
-
74
-
75
-
76
-
77
-
78
-
79
-
80
-
81
-
82
-
83
-
84
-
85
-
86
-
87
-
88
-
89
-
90
-
91
-
92
-
93
-
94
-
95
-
96
-
97
-
98
-
99
-
100
-
101
-
102
-
103
-
104
-
105
-
106
-
107
-
108
-
109
-
110
-
111
-
112
-
113
-
114
-
115
-
116
-
117
-
118
-
119
-
120
 |
 |

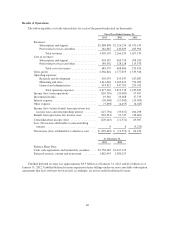
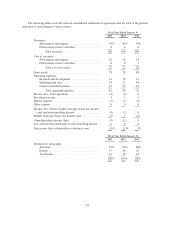
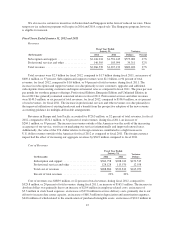
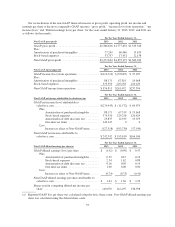
outside subcontractor and other service costs, and an increase of $5.5 million in allocated overhead. Gross profit
margins for professional services and other revenues improved during fiscal 2012 primarily due to the improved
utilization of existing headcount and a benefit from the prospective adoption of the new revenue accounting
guidance for multiple-deliverable arrangements.
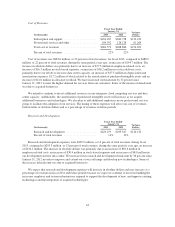
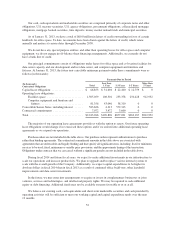
Research and Development.
Fiscal Year Ended
January 31, Variance
Dollars(In thousands) 2012 2011
Research and development ...................... $295,347 $187,887 $107,460
Percent of total revenues ....................... 13% 11%
Research and development expenses were $295.3 million, or 13 percent of total revenues, during fiscal
2012, compared to $187.9 million, or 11 percent of total revenues, during fiscal 2011, an increase of
$107.5 million. The increase in absolute dollars was primarily due to an increase of $66.7 million in employee-
related costs, an increase of $27.0 million in stock-based expenses, an increase of $2.2 million in our
development and test data center, an increase of $1.4 million in depreciation and amortization expenses and an
increase of $8.6 million in allocated overhead. We increased our research and development headcount by
52 percent in fiscal 2012 in order to improve and extend our service offerings and develop new technologies.
Some of the increase in headcount was due to acquired businesses.
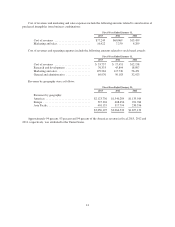
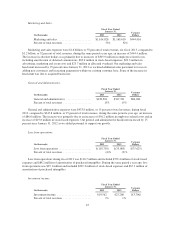
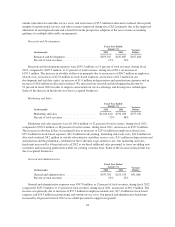
Marketing and Sales.
Fiscal Year Ended
January 31, Variance
Dollars(In thousands) 2012 2011
Marketing and sales ........................... $1,169,610 $792,029 $377,581
Percent of total revenues ....................... 52% 48%
Marketing and sales expenses were $1,169.6 million, or 52 percent of total revenues, during fiscal 2012,
compared to $792.0 million, or 48 percent of total revenues, during fiscal 2011, an increase of $377.6 million.
The increase in absolute dollars was primarily due to increases of $255.6 million in employee-related costs,
$59.3 million in stock-based expenses, $22.5 million in advertising, marketing and event costs, $21.8 million in
allocated overhead, $8.2 million in outside subcontractor and other service costs, $3.1 million in depreciation and
amortization and the preliminary settlement of the California wage and hour case. Our marketing and sales
headcount increased by 44 percent in fiscal 2012 as we hired additional sales personnel to focus on adding new
customers and increasing penetration within our existing customer base. Some of the increase in headcount was
due to acquired businesses.
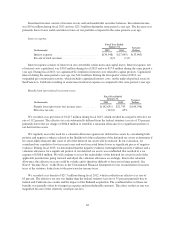
General and Administrative.
Fiscal Year Ended
January 31, Variance
Dollars(In thousands) 2012 2011
General and administrative ..................... $347,781 $255,913 $91,868
Percent of total revenues ....................... 15% 15%
General and administrative expenses were $347.8 million, or 15 percent of total revenues, during fiscal 2012,
compared to $255.9 million, or 15 percent of total revenues, during fiscal 2011, an increase of $91.9 million. The
increase was primarily due to increases of $57.5 million in employee-related costs, $17.3 million in stock-based
expenses and $14.3 million in professional and outside service costs. Our general and administrative headcount
increased by 46 percent in fiscal 2012 as we added personnel to support our growth.
48