Salesforce.com 2013 Annual Report Download - page 65
Download and view the complete annual report
Please find page 65 of the 2013 Salesforce.com annual report below. You can navigate through the pages in the report by either clicking on the pages listed below, or by using the keyword search tool below to find specific information within the annual report.-
 1
1 -
2
-
3
-
4
-
5
-
6
-
7
-
8
-
9
-
10
-
11
-
12
-
13
-
14
-
15
-
16
-
17
-
18
-
19
-
20
-
21
-
22
-
23
-
24
-
25
-
26
-
27
-
28
-
29
-
30
-
31
-
32
-
33
-
34
-
35
-
36
-
37
-
38
-
39
-
40
-
41
-
42
-
43
-
44
-
45
-
46
-
47
-
48
-
49
-
50
-
51
-
52
-
53
-
54
-
 55
55 -
 56
56 -
 57
57 -
 58
58 -
 59
59 -
 60
60 -
 61
61 -
 62
62 -
 63
63 -
 64
64 -
 65
65 -
 66
66 -
 67
67 -
 68
68 -
 69
69 -
 70
70 -
 71
71 -
 72
72 -
 73
73 -
 74
74 -
 75
75 -
76
-
77
-
78
-
79
-
80
-
81
-
82
-
83
-
84
-
85
-
86
-
87
-
88
-
89
-
90
-
91
-
92
-
93
-
94
-
95
-
96
-
97
-
98
-
99
-
100
-
101
-
102
-
103
-
104
-
105
-
106
-
107
-
108
-
109
-
110
-
111
-
112
-
113
-
114
-
115
-
116
-
117
-
118
-
119
-
120
 |
 |

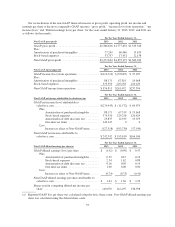
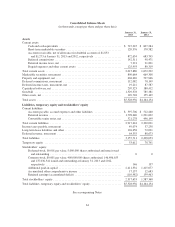
Consolidated Balance Sheets
(in thousands, except per share and per share data)
January 31,
2013
January 31,
2012
Assets
Current assets:
Cash and cash equivalents ............................................ $ 747,245 $ 607,284
Short-term marketable securities ....................................... 120,376 170,582
Accounts receivable, net of allowance for doubtful accounts of $1,853
and $1,273 at January 31, 2013 and 2012, respectively ................... 872,634 683,745
Deferred commissions ............................................... 142,311 98,471
Deferred income taxes, net ........................................... 7,321 31,821
Prepaid expenses and other current assets ............................... 125,993 80,319
Total current assets ..................................................... 2,015,880 1,672,222
Marketable securities, noncurrent .......................................... 890,664 669,308
Property and equipment, net .............................................. 604,669 527,946
Deferred commissions, noncurrent ......................................... 112,082 78,149
Deferred income taxes, noncurrent, net ..................................... 19,212 87,587
Capitalized software, net ................................................. 207,323 188,412
Goodwill ............................................................. 1,529,378 785,381
Other assets, net ........................................................ 149,748 155,149
Total assets ........................................................... $5,528,956 $4,164,154
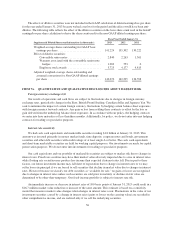
Liabilities, temporary equity and stockholders’ equity
Current liabilities:
Accounts payable, accrued expenses and other liabilities ................... $ 597,706 $ 512,260
Deferred revenue ................................................... 1,798,640 1,291,622
Convertible senior notes, net .......................................... 521,278 496,149
Total current liabilities .................................................. 2,917,624 2,300,031
Income taxes payable, noncurrent .......................................... 49,074 37,258
Long-term lease liabilities and other ........................................ 126,658 72,091
Deferred revenue, noncurrent ............................................. 64,355 88,673
Total liabilities ........................................................ 3,157,711 2,498,053
Temporary equity ...................................................... 53,612 78,741
Stockholders’ equity:
Preferred stock, $0.001 par value; 5,000,000 shares authorized and none issued
and outstanding .................................................. 0 0
Common stock, $0.001 par value; 400,000,000 shares authorized, 146,406,655
and 137,036,541 issued and outstanding at January 31, 2013 and 2012,
respectively ..................................................... 146 137
Additional paid-in capital ............................................ 2,411,332 1,415,077
Accumulated other comprehensive income .............................. 17,137 12,683
Retained earnings (accumulated deficit) ................................. (110,982) 159,463
Total stockholders’ equity ................................................ 2,317,633 1,587,360
Total liabilities, temporary equity and stockholders’ equity ...................... $5,528,956 $4,164,154
See accompanying Notes.
61