Royal Caribbean Cruise Lines 2001 Annual Report Download - page 49
Download and view the complete annual report
Please find page 49 of the 2001 Royal Caribbean Cruise Lines annual report below. You can navigate through the pages in the report by either clicking on the pages listed below, or by using the keyword search tool below to find specific information within the annual report.
Notes to the Consolidated Financial Statements (continued)
Royal Caribbean Cruises Ltd. 47
STOCK OPTION ACTIVITY
2001 2000 1999
Weighted Weighted Weighted
Number of Average Number of Average Number of Average
Options Exercise Price Options Exercise Price Options Exercise Price
Outstanding options at January 1 11,291,784 $27.17 6,894,172 $24.82 6,492,390 $16.78
Granted 6,525,775 $12.41 5,036,100 $30.21 2,285,500 $39.23
Exercised (104,526) $13.22 (186,436) $12.68 (1,318,714) $11.01
Canceled (690,792) $29.84 (452,052) $30.65 (565,004) $23.03
㛭㛭㛭㛭㛭㛭㛭㛭㛭㛭㛭㛭㛭㛭 㛭㛭㛭㛭㛭㛭㛭㛭㛭㛭㛭㛭㛭㛭 㛭㛭㛭㛭㛭㛭㛭㛭㛭㛭㛭㛭
Outstanding options at December 31 17,022,241 $21.49 11,291,784 $27.17 6,894,172 $24.82
㛮㛮㛮㛮㛮㛮㛮 㛮㛮㛮㛮㛮㛮㛮 㛮㛮㛮㛮㛮㛮
Options exercisable at December 31 4,679,421 $20.79 2,707,234 $16.02 1,649,180 $12.53
㛮㛮㛮㛮㛮㛮㛮 㛮㛮㛮㛮㛮㛮㛮 㛮㛮㛮㛮㛮㛮
Available for future grants at December 31 5,871,763 3,839,246 8,553,864
㛮㛮㛮㛮㛮㛮㛮 㛮㛮㛮㛮㛮㛮㛮 㛮㛮㛮㛮㛮㛮
STOCK OPTIONS OUTSTANDING
As of December 31, 2001 Options Outstanding Options Exercisable
Weighted Weighted Weighted
Number Average Average Number Average
Exercise Price Range Outstanding Remaining Life Exercise Price Exercisable Exercise Price
$ 7.24 – $ 9.90 5,846,545 9.2 years $ 9.79 432,870 $ 8.83
$11.19 – $20.30 3,912,196 6.7 years $17.35 2,354,826 $15.55
$21.92 – $28.78 3,961,250 7.5 years $25.72 1,153,550 $24.09
$28.88 – $48.00 3,302,250 7.7 years $42.05 738,175 $39.34
17,022,241 7.9 years $21.49 4,679,421 $20.79
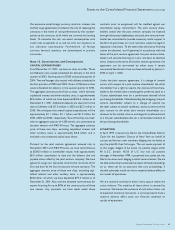
We use the intrinsic value method of accounting for stock-
based compensation. Had the fair value based method been
used to account for such compensation, compensation costs
would have reduced net income by $37.0 million, $28.8 million
and $15.0 million or $0.19, $0.15 and $0.08 per share in 2001,
2000 and 1999, respectively. The weighted-average fair value
of options granted during 2001, 2000 and 1999 was
$4.35, $12.43 and $15.52, respectively. Fair value information
for our stock options was estimated using the Black-Scholes
option-pricing model based on the following weighted
average assumptions:
2001 2000 1999
Dividend yield 2.5% 2.0% 1.0%
Expected stock price volatility 43.3% 38.4% 35.6%
Risk-free interest rate 4% 6% 5%
Expected option life 5 years 6 years 6 years
Note 8. Earnings Per Share
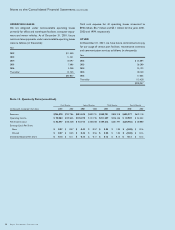
Below is a reconciliation between basic and diluted earnings per share for the years ended December 31, 2001, 2000 and 1999
(in thousands, except per share data):
Year Ended December 31,
2001 2000 1999
Per Per Per
Income Shares Share Income Shares Share Income Shares Share
Net income $254,457 $445,363 $383,853
Less: preferred stock dividends –(1,933) (12,506)
㛭㛭㛭㛭㛭㛭㛭㛭㛭
㛭
㛭㛭㛭㛭㛭㛭㛭㛭
㛭
㛭㛭㛭㛭㛭㛭㛭㛭
㛭
Basic earnings per share 254,457 192,231 $1.32 443,430 189,397 $2.34 371,347 172,319 $2.15
Effect of dilutive securities:
Stock options 1,250 1,428 3,508
Convertible preferred stock –– 1,933 2,110 12,506 10,629
㛭㛭㛭㛭㛭㛭㛭㛭㛭㛭㛭㛭㛭㛭㛭㛭㛭㛭㛭㛭
㛭
㛭㛭㛭㛭㛭㛭㛭㛭㛭㛭㛭㛭㛭㛭㛭㛭㛭㛭
㛭
㛭㛭㛭㛭㛭㛭㛭㛭㛭㛭㛭㛭㛭㛭
㛭
Diluted earnings per share $254,457 193,481 $1.32 $445,363 192,935 $2.31 $383,853 186,456 $2.06


