Royal Caribbean Cruise Lines 2001 Annual Report Download - page 43
Download and view the complete annual report
Please find page 43 of the 2001 Royal Caribbean Cruise Lines annual report below. You can navigate through the pages in the report by either clicking on the pages listed below, or by using the keyword search tool below to find specific information within the annual report.-
 1
1 -
2
-
3
-
4
-
5
-
6
-
7
-
8
-
9
-
10
-
11
-
12
-
13
-
14
-
15
-
16
-
17
-
18
-
19
-
20
-
21
-
22
-
23
-
24
-
25
-
26
-
27
-
28
-
29
-
30
-
31
-
32
-
 33
33 -
 34
34 -
 35
35 -
 36
36 -
 37
37 -
 38
38 -
 39
39 -
 40
40 -
 41
41 -
 42
42 -
 43
43 -
 44
44 -
 45
45 -
 46
46 -
 47
47 -
 48
48 -
 49
49 -
 50
50 -
 51
51 -
 52
52 -
 53
53 -
54
-
55
-
56
 |
 |

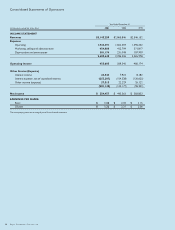
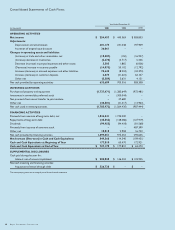
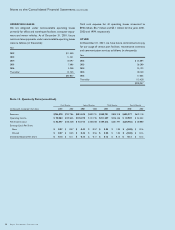
Consolidated Statements of Shareholders’ Equity
Royal Caribbean Cruises Ltd. 41
Accumulated
Other Total
Preferred Common Paid-in Retained Comprehensive Treasury Shareholders’
(in thousands) Stock Stock Capital Earnings Income (Loss) Stock Equity
Balances at January 1, 1999 $ 172,500 $ 1,690 $ 1,361,796 $ 923,691 $ – $(4,919) $2,454,758
Issuance of common stock – 108 487,291 – – – 487,399
Issuance under preferred
stock conversion (300) – 300 – – – –
Issuance under employee related plans – 14 17,260 – – (560) 16,714
Preferred stock dividends – – – (12,506) – – (12,506)
Common stock dividends – – – (69,062) – – (69,062)
Net income – – – 383,853 – – 383,853
Balances at December 31, 1999 172,200 1,812 1,866,647 1,225,976 – (5,479) 3,261,156
Issuance under preferred
stock conversion (172,200) 106 172,094 – – – –
Issuance under employee related plans – 3 4,370 – – (559) 3,814
Preferred stock dividends – – – (3,121) – – (3,121)
Common stock dividends – – – (91,297) – – (91,297)
Net income – – – 445,363 – – 445,363
Balances at December 31, 2000 – 1,921 2,043,111 1,576,921 – (6,038) 3,615,915
Issuance under employee related plans – 2 2,793 – – (560) 2,235
Common stock dividends – – – (99,955) – – (99,955)
Transition adjustment SFAS No. 133 – – – – 7,775 – 7,775
Changes related to cash flow
derivative hedges – – – – (23,843) – (23,843)
Net income – – – 254,457 – – 254,457
Balances at December 31, 2001 $ – $1,923 $2,045,904 $1,731,423 $(16,068) $(6,598) $3,756,584
Comprehensive income is as follows:
Year Ended December 31,
(in thousands) 2001 2000 1999
Net income $254,457 $445,363 $383,853
Transition adjustment SFAS No. 133 7,775 ––
Changes related to cash flow
derivative hedges (23,843) ––
Total comprehensive income $238,389 $445,363 $383,853
The accompanying notes are an integral part of these financial statements.