Royal Caribbean Cruise Lines 2001 Annual Report Download - page 34
Download and view the complete annual report
Please find page 34 of the 2001 Royal Caribbean Cruise Lines annual report below. You can navigate through the pages in the report by either clicking on the pages listed below, or by using the keyword search tool below to find specific information within the annual report.-
 1
1 -
2
-
3
-
4
-
5
-
6
-
7
-
8
-
9
-
10
-
11
-
12
-
13
-
14
-
15
-
16
-
17
-
18
-
19
-
20
-
21
-
22
-
23
-
 24
24 -
 25
25 -
 26
26 -
 27
27 -
 28
28 -
 29
29 -
 30
30 -
 31
31 -
 32
32 -
 33
33 -
 34
34 -
 35
35 -
 36
36 -
 37
37 -
 38
38 -
 39
39 -
 40
40 -
 41
41 -
 42
42 -
 43
43 -
 44
44 -
45
-
46
-
47
-
48
-
49
-
50
-
51
-
52
-
53
-
54
-
55
-
56
 |
 |

Management’s Discussion and Analysis of Financial Condition and Results of Operations (continued)
32 Royal Caribbean Cruises Ltd.
Year Ended December 31, 2001 Compared to Year
Ended December 31, 2000
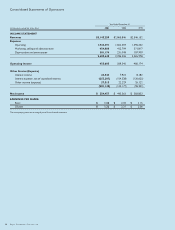
REVENUES
Revenues increased 9.7% to $3.1 billion from $2.9 billion for
the same period in 2000. The increase in revenues was due
primarily to a 20.8% increase in capacity, partially offset by a
9.1% decline in gross revenue per available passenger cruise
day. The increase in capacity was primarily due to the addition
of Millennium and Explorer of the Seas in 2000, and Infinity,
Radiance of the Seas, Summit and Adventure of the Seas in
2001. The increase in new capacity was partially offset by the
cancellation of 14 weeks of sailings due to ship incidents and
the events of September 11, 2001. The decline in gross
revenue per available passenger cruise day was primarily
attributed to the events related to September 11, 2001, a
general softness in the U.S. economy and a significant growth
of our fleet capacity. Net revenue per available passenger
cruise day for 2001 declined 9.1% from the prior year.
Occupancy for 2001 was 101.8% compared to 104.4% in 2000.
Starting in early 2001, we experienced a softness in bookings
which we attribute to the weakening U.S. economy.
By mid-summer, we started to see a recovery in this trend,
with booking volume and pricing improving. Following the
terrorist attacks of September 11, 2001, there was a substantial
drop in bookings and an increase in cancellations. After the
initial decline, bookings gradually improved, prompted initially
by substantial discounts. Pricing began to recover by
mid-November. Booking patterns, which shifted to closer-in
sailing dates following September 11, also began to return to
pre-September 11 patterns.
EXPENSES
Operating expenses increased 17.1% to $1.9 billion in 2001
compared to $1.7 billion for the same period in 2000. The
increase is primarily due to additional costs associated with
increased capacity.
Marketing, selling and administrative expenses increased
10.0% to $454.1 million in 2001 from $412.8 million in 2000.
On a per available passenger cruise day basis, marketing,
selling and administrative expenses decreased 8.9% due
primarily to economies of scale and cost containment efforts,
partially offset by business decisions taken subsequent to the
events of September 11, 2001 involving itinerary changes, office
closures, and severance costs related to a reduction in force.
Marketing, selling and administrative expenses as a percentage
of revenues were 14.4% for 2001 and 2000.
Cost savings initiatives from 2000 and 2001 contributed to a
4.5% reduction in operating costs and marketing, selling and
administrative expenses on a per available passenger cruise
day basis, excluding fuel costs, in 2001 compared to 2000. We
expect a similar improvement in 2002.
Depreciation and amortization increased 30.4% to $301.2 million
in 2001 from $231.0 million in 2000. The increase is primarily
due to incremental depreciation associated with the addition of
new ships.
OTHER INCOME (EXPENSE)
Gross interest expense (excluding capitalized interest)
increased to $290.2 million in 2001 compared to $198.5 million
in 2000. The increase is due primarily to an increase in the
average debt level associated with our fleet expansion
program, partially offset by a reduction in our weighted
average interest rate. Capitalized interest decreased from
$44.2 million in 2000 to $37.0 million in 2001 due to a lower
average level of investment in ships under construction and
lower interest rates.
Included in Other income (expense) in 2001 and 2000 is
$19.4 million and $9.2 million, respectively, of dividend income
from our investment in convertible preferred stock of First
Choice Holidays PLC and $7.2 million and $10.2 million in 2001
and 2000, respectively, of compensation from a shipyard related
to the delivery of ships. (See Liquidity and Capital Resources.)