Royal Caribbean Cruise Lines 2001 Annual Report Download - page 30
Download and view the complete annual report
Please find page 30 of the 2001 Royal Caribbean Cruise Lines annual report below. You can navigate through the pages in the report by either clicking on the pages listed below, or by using the keyword search tool below to find specific information within the annual report.-
 1
1 -
2
-
3
-
4
-
5
-
6
-
7
-
8
-
9
-
10
-
11
-
12
-
13
-
14
-
15
-
16
-
17
-
18
-
19
-
 20
20 -
 21
21 -
 22
22 -
 23
23 -
 24
24 -
 25
25 -
 26
26 -
 27
27 -
 28
28 -
 29
29 -
 30
30 -
 31
31 -
 32
32 -
 33
33 -
 34
34 -
 35
35 -
 36
36 -
 37
37 -
 38
38 -
 39
39 -
 40
40 -
41
-
42
-
43
-
44
-
45
-
46
-
47
-
48
-
49
-
50
-
51
-
52
-
53
-
54
-
55
-
56
 |
 |

Management’s Discussion and Analysis of Financial Condition and Results of Operations
28 Royal Caribbean Cruises Ltd.
As used in this document, the terms “Royal Caribbean,” “we,”
“our” and “us” refer to Royal Caribbean Cruises Ltd., the term
“Celebrity” refers to Celebrity Cruise Lines Inc. and the terms
“Royal Caribbean International” and “Celebrity Cruises” refer to
our two cruise brands. In accordance with industry practice, the
term “berths” is determined based on double occupancy per cabin
even though some cabins can accommodate three or four guests.
Certain statements under this caption “Management’s
Discussion and Analysis of Financial Condition and Results of
Operations,” in our letter to shareholders and elsewhere in
this document constitute forward-looking statements under the
Private Securities Litigation Reform Act of 1995. Forward-
looking statements do not guarantee future performance and
may involve risks, uncertainties and other factors which could
cause our actual results, performance or achievements to differ
materially from the future results, performance or achievements
expressed or implied in those forward-looking statements.
Examples of these risks, uncertainties and other factors include,
but are not limited to:
• general economic and business conditions,
• cruise industry competition,
• changes in vacation industry capacity, including cruise capacity,
• the impact of tax laws and regulations affecting our business
or our principal shareholders,
• the impact of changes in other laws and regulations affecting
our business,
• the impact of pending or threatened litigation,
• the delivery of scheduled new vessels,
• emergency ship repairs,
• incidents involving cruise vessels at sea,
• reduced consumer demand for cruises as a result of any
number of reasons, including armed conflict, political insta-
bility, or the unavailability of air service,
• changes in interest rates or oil prices, and
• weather.
The above examples may not be exhaustive and new risks emerge
from time to time. We undertake no obligation to publicly update
or revise any forward-looking statements, whether as a result of
new information, future events or otherwise.
General
SUMMARY
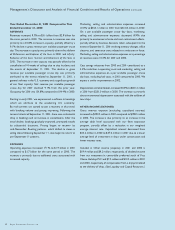
We reported net income and earnings per share for the year
ended December 31, 2001 as shown in the table below. Net
income decreased 42.9% to $254.5 million or $1.32 per share
on a diluted basis in 2001 compared to $445.4 million or
$2.31 per share in 2000. The decrease in net income is primarily
the result of lost revenues and additional costs associated with
events related to September 11, 2001, and ships out of service.
Additionally, net income was impacted by a decline in net
revenues per available passenger cruise day due to a general
softness in the U.S. economy and a significant growth of our
fleet capacity. The increase in capacity is associated with the
addition of Millennium and Explorer of the Seas in 2000 and
Infinity, Radiance of the Seas, Summit, and Adventure of the Seas
in 2001.
Net income for 2001 was adversely impacted by approximately
$47.7 million due to lost revenues and extra costs directly
associated with passengers not being able to reach their depar-
ture ports during the weeks following the terrorist attacks
of September 11, 2001 and costs associated with business deci-
sions taken in the aftermath of the attacks. Also, net income
was negatively impacted by approximately $30.7 million from
the cancellation of nine weeks of sailings due to ship incidents,
partially offset by $14.0 million related to insurance claims from
prior years. Net income for 1999 was adversely impacted by
$17.3 million of non-recurring settlement-related charges and
by $12.8 million, net of insurance recoveries, for ships out of
service. Accordingly, on a comparable basis, before the impact
of September 11, 2001, ships out of service, insurance claims
and the settlement charges, earnings were $318.9 million or
$1.65 per share in 2001 versus $445.4 million or $2.31 per
share in 2000 and $414.0 million or $2.22 per share in 1999.
There were no significant events or circumstances in 2000 for
which an adjustment was appropriate to make 2000 net income
comparable to adjusted 2001 and 1999 earnings.
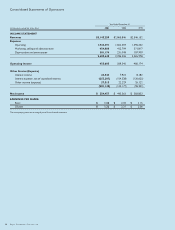
(in thousands, Year Ended December 31,
except per share data) 2001 2000 1999
Revenues $3,145,250 $2,865,846 $2,546,152
Operating Income 455,605 569,540 480,174
Net Income 254,457 445,363 383,853
Basic Earnings
Per Share $ 1.32 $ 2.34 $ 2.15
Diluted Earnings
Per Share $ 1.32 $ 2.31 $ 2.06