Royal Caribbean Cruise Lines 2001 Annual Report Download - page 35
Download and view the complete annual report
Please find page 35 of the 2001 Royal Caribbean Cruise Lines annual report below. You can navigate through the pages in the report by either clicking on the pages listed below, or by using the keyword search tool below to find specific information within the annual report.-
 1
1 -
2
-
3
-
4
-
5
-
6
-
7
-
8
-
9
-
10
-
11
-
12
-
13
-
14
-
15
-
16
-
17
-
18
-
19
-
20
-
21
-
22
-
23
-
24
-
 25
25 -
 26
26 -
 27
27 -
 28
28 -
 29
29 -
 30
30 -
 31
31 -
 32
32 -
 33
33 -
 34
34 -
 35
35 -
 36
36 -
 37
37 -
 38
38 -
 39
39 -
 40
40 -
 41
41 -
 42
42 -
 43
43 -
 44
44 -
 45
45 -
46
-
47
-
48
-
49
-
50
-
51
-
52
-
53
-
54
-
55
-
56
 |
 |

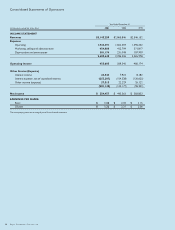
Management’s Discussion and Analysis of Financial Condition and Results of Operations (continued)
Royal Caribbean Cruises Ltd. 33
Year Ended December 31, 2000 Compared to Year
Ended December 31, 1999
REVENUES
Revenues increased 12.6% to $2.9 billion in 2000 compared to
$2.5 billion for the same period in 1999. The increase in
revenues is due to a 16.4% increase in capacity partially offset
by a 3.3% decline in gross revenue per available passenger
cruise day. The increase in capacity is primarily associated with
the addition to the fleet of Voyager of the Seas in 1999, and
Millennium and Explorer of the Seas in 2000. The decline in
gross revenue per available passenger cruise day was due to
lower cruise ticket prices, a lower percentage of guests
electing to use our air program and lower shipboard revenue
per diems due to a higher use of concessionaires onboard the
Royal Caribbean International vessels in 2000. Concessionaires
pay us a net commission, which is recorded as revenue, in
contrast to in-house operations, where shipboard revenues
and related cost of sales are recorded on a gross basis. Net
revenue per available passenger cruise day for 2000 was
approximately the same as in 1999. Occupancy for 2000
was 104.4% compared to 104.7% in 1999.
EXPENSES
Operating expenses increased 10.4% to $1.7 billion in 2000 as
compared to $1.5 billion in 1999. The increase is primarily due
to additional costs associated with increased capacity and an
increase in fuel costs, partially offset by a decrease in air
expenses due to a lower percentage of guests electing to use
our air program, as well as lower shipboard cost of sales due to
the increased use of concessionaires as discussed previously.
Included in 1999 operating expenses are charges of
$17.3 million related to settlements with the U.S. Department
of Justice and the State of Alaska. Excluding the settlements,
operating expenses as a percentage of revenues decreased to
57.7% in 2000 from 58.1% in 1999.
Marketing, selling and administrative expenses increased
11.0% to $412.8 million in 2000 from $371.8 million in 1999.
The increase is primarily due to television advertising costs
associated with our new advertising campaigns to promote
brand awareness, as well as increased administrative staffing
levels and investment in information technology to support our
growth. Marketing, selling and administrative expenses as a
percentage of revenues decreased from 14.6% in 1999 to
14.4% in 2000.
Depreciation and amortization increased 16.7% to $231.0 million
in 2000 from $197.9 million in 1999. The increase is due
to incremental depreciation associated with the addition of
new ships, as well as shoreside capital expenditures primarily
related to information technology in support of our growth plans.
OTHER INCOME (EXPENSE)
Gross interest expense (excluding capitalized interest)
increased to $198.5 million in 2000 as compared to
$165.2 million in 1999. The increase is due primarily to higher
debt levels associated with our fleet expansion program and
higher interest rates. Capitalized interest increased $9.6 million
from $34.6 million in 1999 to $44.2 million in 2000, due to an
increase in expenditures related to ships under construction.
Included in Other income (expense) in 2000 is approximately
$10.2 million of compensation from a shipyard related to the
delivery of Millennium and $9.2 million of dividend income
from our July 2000 investment in convertible preferred stock
of First Choice Holidays PLC. (See Liquidity and Capital
Resources.) Included in Other income (expense) in 1999 is
$26.5 million of loss-of-hire insurance resulting from ships out
of service.
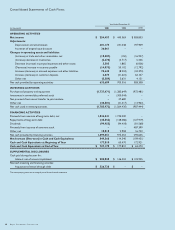
Liquidity and Capital Resources
SOURCES AND USES OF CASH
Net cash provided by operating activities was $633.7 million in
2001 as compared to $703.3 million in 2000 and $583.4 million
in 1999. The change in each year was primarily due to fluctuations
in net income.
During the year ended December 31, 2001, our capital
expenditures were approximately $2.1 billion, consisting of
approximately $1.8 billion in cash payments and approximately
$0.3 billion related to the acquisition of a vessel through debt,
as compared to $1.3 billion during 2000 and $1.0 billion during
1999. The largest portion of capital expenditures related to the
deliveries of Infinity, Radiance of the Seas, Summit, and
Adventure of the Seas in 2001; Millennium and Explorer of the
Seas in 2000; and Voyager of the Seas in 1999, as well as
progress payments for ships under construction in all years.