Regions Bank 2012 Annual Report Download - page 95
Download and view the complete annual report
Please find page 95 of the 2012 Regions Bank annual report below. You can navigate through the pages in the report by either clicking on the pages listed below, or by using the keyword search tool below to find specific information within the annual report.-
 1
1 -
2
-
3
-
4
-
5
-
6
-
7
-
8
-
9
-
10
-
11
-
12
-
13
-
14
-
15
-
16
-
17
-
18
-
19
-
20
-
21
-
22
-
23
-
24
-
25
-
26
-
27
-
28
-
29
-
30
-
31
-
32
-
33
-
34
-
35
-
36
-
37
-
38
-
39
-
40
-
41
-
42
-
43
-
44
-
45
-
46
-
47
-
48
-
49
-
50
-
51
-
52
-
53
-
54
-
55
-
56
-
57
-
58
-
59
-
60
-
61
-
62
-
63
-
64
-
65
-
66
-
67
-
68
-
69
-
70
-
71
-
72
-
73
-
74
-
75
-
76
-
77
-
78
-
79
-
80
-
81
-
82
-
83
-
84
-
 85
85 -
 86
86 -
 87
87 -
 88
88 -
 89
89 -
 90
90 -
 91
91 -
 92
92 -
 93
93 -
 94
94 -
 95
95 -
 96
96 -
 97
97 -
 98
98 -
 99
99 -
 100
100 -
 101
101 -
 102
102 -
 103
103 -
 104
104 -
 105
105 -
106
-
107
-
108
-
109
-
110
-
111
-
112
-
113
-
114
-
115
-
116
-
117
-
118
-
119
-
120
-
121
-
122
-
123
-
124
-
125
-
126
-
127
-
128
-
129
-
130
-
131
-
132
-
133
-
134
-
135
-
136
-
137
-
138
-
139
-
140
-
141
-
142
-
143
-
144
-
145
-
146
-
147
-
148
-
149
-
150
-
151
-
152
-
153
-
154
-
155
-
156
-
157
-
158
-
159
-
160
-
161
-
162
-
163
-
164
-
165
-
166
-
167
-
168
-
169
-
170
-
171
-
172
-
173
-
174
-
175
-
176
-
177
-
178
-
179
-
180
-
181
-
182
-
183
-
184
-
185
-
186
-
187
-
188
-
189
-
190
-
191
-
192
-
193
-
194
-
195
-
196
-
197
-
198
-
199
-
200
-
201
-
202
-
203
-
204
-
205
-
206
-
207
-
208
-
209
-
210
-
211
-
212
-
213
-
214
-
215
-
216
-
217
-
218
-
219
-
220
-
221
-
222
-
223
-
224
-
225
-
226
-
227
-
228
-
229
-
230
-
231
-
232
-
233
-
234
-
235
-
236
-
237
-
238
-
239
-
240
-
241
-
242
-
243
-
244
-
245
-
246
-
247
-
248
-
249
-
250
-
251
-
252
-
253
-
254
 |
 |
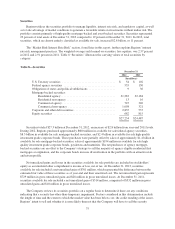
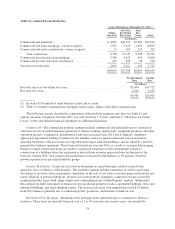
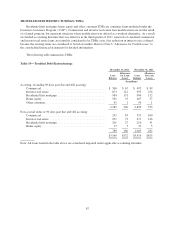
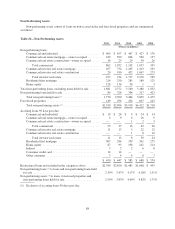
borrowers to finance their primary residence. These loans experienced a $0.8 billion decline to $13.0 billion in
2012, primarily due to consumer deleveraging. However, mortgage origination volume increased to $8.0 billion
in 2012 as compared to $6.3 billion in 2011 reflecting customers taking advantage of the opportunity to refinance
under the extended Home Affordable Refinance Program, or HARP II. A significant portion of mortgage
originations were sold in the secondary market. At the end of 2012, Regions began the process of retaining
15 year fixed-rate mortgage production on the balance sheet which should mitigate additional balance reductions
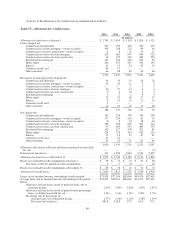
going forward. Refer to Note 6 “Allowance for Credit Losses” to the consolidated financial statements for
additional discussion.
Home Equity—Home equity lending includes both home equity loans and lines of credit. This type of
lending, which is secured by a first or second mortgage on the borrower’s residence, allows customers to borrow
against the equity in their home. Substantially all of this portfolio was originated through Regions’ branch
network. During 2012, home equity balances decreased $1.2 billion to $11.8 billion, driven by consumer
deleveraging and refinancing. Net charge-offs within the home equity portfolio remain elevated, but decreased in
2012 as compared to 2011. Most of the improvement in losses came from Florida second liens because property
values in Florida markets have either stabilized or started to increase. More information related to these
developments is included in the “Home Equity” discussion below.
Indirect— Indirect lending, which is lending initiated through third-party business partners, is largely
comprised of loans made through automotive dealerships. This portfolio class increased $488 million, or
26 percent in 2012, reflecting growth from the late 2010 re-entry into the indirect auto lending business. Regions
currently has over 1,900 dealers in its network.
Consumer Credit Card—During the second quarter of 2011, Regions completed the purchase of
approximately $1.0 billion of existing Regions-branded consumer credit card accounts from FIA Card Services.
The products are primarily open-ended variable interest rate consumer credit card loans. In the third quarter of
2012, Regions assumed the servicing of these loans from FIA Card Services.
Other Consumer—Other consumer loans include direct consumer installment loans, overdrafts and other
revolving loans. Other consumer loans totaled $1.2 billion at December 31, 2012, relatively unchanged from the
prior year.
CREDIT QUALITY
Certain of Regions’ loans have been particularly vulnerable to weak economic conditions over the past
several years, mainly investor real estate loans and home equity products (particularly Florida second lien).
These loan types have a higher risk of non-collection than other loans. The following sections provide further
detail on these portfolios.
79