Regions Bank 2012 Annual Report Download - page 197
Download and view the complete annual report
Please find page 197 of the 2012 Regions Bank annual report below. You can navigate through the pages in the report by either clicking on the pages listed below, or by using the keyword search tool below to find specific information within the annual report.-
 1
1 -
2
-
3
-
4
-
5
-
6
-
7
-
8
-
9
-
10
-
11
-
12
-
13
-
14
-
15
-
16
-
17
-
18
-
19
-
20
-
21
-
22
-
23
-
24
-
25
-
26
-
27
-
28
-
29
-
30
-
31
-
32
-
33
-
34
-
35
-
36
-
37
-
38
-
39
-
40
-
41
-
42
-
43
-
44
-
45
-
46
-
47
-
48
-
49
-
50
-
51
-
52
-
53
-
54
-
55
-
56
-
57
-
58
-
59
-
60
-
61
-
62
-
63
-
64
-
65
-
66
-
67
-
68
-
69
-
70
-
71
-
72
-
73
-
74
-
75
-
76
-
77
-
78
-
79
-
80
-
81
-
82
-
83
-
84
-
85
-
86
-
87
-
88
-
89
-
90
-
91
-
92
-
93
-
94
-
95
-
96
-
97
-
98
-
99
-
100
-
101
-
102
-
103
-
104
-
105
-
106
-
107
-
108
-
109
-
110
-
111
-
112
-
113
-
114
-
115
-
116
-
117
-
118
-
119
-
120
-
121
-
122
-
123
-
124
-
125
-
126
-
127
-
128
-
129
-
130
-
131
-
132
-
133
-
134
-
135
-
136
-
137
-
138
-
139
-
140
-
141
-
142
-
143
-
144
-
145
-
146
-
147
-
148
-
149
-
150
-
151
-
152
-
153
-
154
-
155
-
156
-
157
-
158
-
159
-
160
-
161
-
162
-
163
-
164
-
165
-
166
-
167
-
168
-
169
-
170
-
171
-
172
-
173
-
174
-
175
-
176
-
177
-
178
-
179
-
180
-
181
-
182
-
183
-
184
-
185
-
186
-
 187
187 -
 188
188 -
 189
189 -
 190
190 -
 191
191 -
 192
192 -
 193
193 -
 194
194 -
 195
195 -
 196
196 -
 197
197 -
 198
198 -
 199
199 -
 200
200 -
 201
201 -
 202
202 -
 203
203 -
 204
204 -
 205
205 -
 206
206 -
 207
207 -
208
-
209
-
210
-
211
-
212
-
213
-
214
-
215
-
216
-
217
-
218
-
219
-
220
-
221
-
222
-
223
-
224
-
225
-
226
-
227
-
228
-
229
-
230
-
231
-
232
-
233
-
234
-
235
-
236
-
237
-
238
-
239
-
240
-
241
-
242
-
243
-
244
-
245
-
246
-
247
-
248
-
249
-
250
-
251
-
252
-
253
-
254
 |
 |

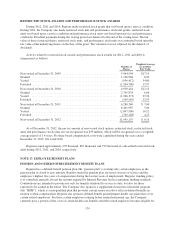
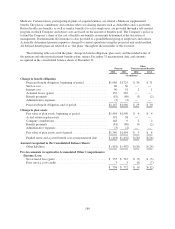
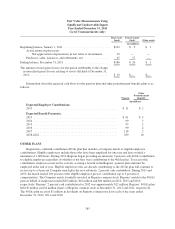
The accumulated benefit obligation for all defined-benefit plans was $2.1 billion and $1.9 billion as of
December 31, 2012 and 2011, respectively, which exceeded all corresponding plan assets as of December 31,
2012 and 2011. Net periodic pension cost included the following components for the year ended December 31:
Pension
2012 2011 2010
(In millions)
Service cost ............................................................. $ 40 $ 36 $ 36
Interest cost ............................................................. 90 91 93
Expected return on plan assets .............................................. (115) (121) (107)
Amortization of actuarial loss ............................................... 71 45 44
Amortization of prior service cost ............................................111
Settlement charge ........................................................ — — 3
Net periodic benefit cost ................................................... $ 87 $ 52 $ 70
There was no material impact from other postretirement benefits on the consolidated statements of
operations for December 31, 2012, 2011 and 2010.
The estimated amounts that will be amortized from accumulated other comprehensive income (loss) into net
periodic benefit cost in 2013 are as follows:
Pension
Other
Postretirement Benefits
(In millions)
Actuarial loss .................................... $66 $—
Prior service cost (credit) ........................... 1 (1)
$67 $ (1)
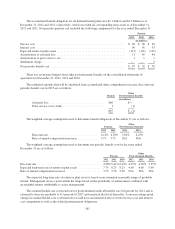
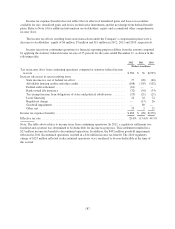
The weighted-average assumptions used to determine benefit obligations at December 31 are as follows:
Pension
Other
Postretirement Benefits
2012 2011 2012 2011
Discount rate ................................ 4.21% 4.58% 3.60% 4.25%
Rate of annual compensation increase ............. 3.75 3.75 N/A N/A
The weighted-average assumptions used to determine net periodic benefit cost for the years ended
December 31 are as follows:
Pension
Other
Postretirement Benefits
2012 2011 2010 2012 2011 2010
Discount rate ........................................... 4.58% 5.41% 6.02% 4.25% 4.90% 5.35%
Expected long-term rate of return on plan assets ............... 7.75 8.25 8.25 4.00 4.00 5.00
Rate of annual compensation increase ....................... 3.75 3.76 5.00 N/A N/A N/A
The expected long-term rate of return on plan assets is based on an estimated reasonable range of probable
returns. Management chose a point within the range based on the probability of achievement combined with
incremental returns attributable to active management.
The assumed health care cost trend rate for postretirement medical benefits was 6.8 percent for 2012 and is
assumed to decrease gradually to 4.5 percent by 2027 and remain at that level thereafter. A one-percentage point
change in assumed health care cost trend rates would have an immaterial effect on total service cost and interest
cost components as well as the related postretirement obligations.
181