Regions Bank 2012 Annual Report Download - page 221
Download and view the complete annual report
Please find page 221 of the 2012 Regions Bank annual report below. You can navigate through the pages in the report by either clicking on the pages listed below, or by using the keyword search tool below to find specific information within the annual report.-
 1
1 -
2
-
3
-
4
-
5
-
6
-
7
-
8
-
9
-
10
-
11
-
12
-
13
-
14
-
15
-
16
-
17
-
18
-
19
-
20
-
21
-
22
-
23
-
24
-
25
-
26
-
27
-
28
-
29
-
30
-
31
-
32
-
33
-
34
-
35
-
36
-
37
-
38
-
39
-
40
-
41
-
42
-
43
-
44
-
45
-
46
-
47
-
48
-
49
-
50
-
51
-
52
-
53
-
54
-
55
-
56
-
57
-
58
-
59
-
60
-
61
-
62
-
63
-
64
-
65
-
66
-
67
-
68
-
69
-
70
-
71
-
72
-
73
-
74
-
75
-
76
-
77
-
78
-
79
-
80
-
81
-
82
-
83
-
84
-
85
-
86
-
87
-
88
-
89
-
90
-
91
-
92
-
93
-
94
-
95
-
96
-
97
-
98
-
99
-
100
-
101
-
102
-
103
-
104
-
105
-
106
-
107
-
108
-
109
-
110
-
111
-
112
-
113
-
114
-
115
-
116
-
117
-
118
-
119
-
120
-
121
-
122
-
123
-
124
-
125
-
126
-
127
-
128
-
129
-
130
-
131
-
132
-
133
-
134
-
135
-
136
-
137
-
138
-
139
-
140
-
141
-
142
-
143
-
144
-
145
-
146
-
147
-
148
-
149
-
150
-
151
-
152
-
153
-
154
-
155
-
156
-
157
-
158
-
159
-
160
-
161
-
162
-
163
-
164
-
165
-
166
-
167
-
168
-
169
-
170
-
171
-
172
-
173
-
174
-
175
-
176
-
177
-
178
-
179
-
180
-
181
-
182
-
183
-
184
-
185
-
186
-
187
-
188
-
189
-
190
-
191
-
192
-
193
-
194
-
195
-
196
-
197
-
198
-
199
-
200
-
201
-
202
-
203
-
204
-
205
-
206
-
207
-
208
-
209
-
210
-
 211
211 -
 212
212 -
 213
213 -
 214
214 -
 215
215 -
 216
216 -
 217
217 -
 218
218 -
 219
219 -
 220
220 -
 221
221 -
 222
222 -
 223
223 -
 224
224 -
 225
225 -
 226
226 -
 227
227 -
 228
228 -
 229
229 -
 230
230 -
 231
231 -
232
-
233
-
234
-
235
-
236
-
237
-
238
-
239
-
240
-
241
-
242
-
243
-
244
-
245
-
246
-
247
-
248
-
249
-
250
-
251
-
252
-
253
-
254
 |
 |

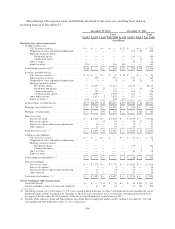
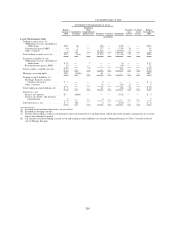
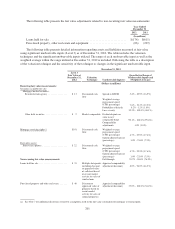
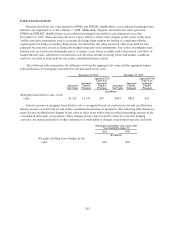
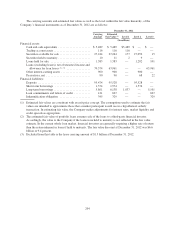
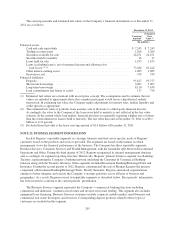
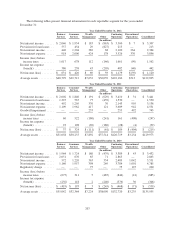
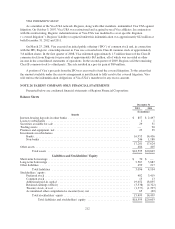
The carrying amounts and estimated fair values of the Company’s financial instruments as of December 31,
2011 are as follows:
December 31, 2011
Carrying
Amount
Estimated
Fair
Value (1)
(In millions)
Financial assets:
Cash and cash equivalents ................................................ $ 7,245 $ 7,245
Trading account assets ................................................... 1,266 1,266
Securities available for sale ............................................... 24,471 24,471
Securities held to maturity ................................................ 16 17
Loans held for sale ...................................................... 1,193 1,193
Loans (excluding leases), net of unearned income and allowance for
loan losses (2), (3) ...................................................... 73,284 65,224
Other interest-earning assets .............................................. 1,085 1,085
Derivatives, net ......................................................... 339 339
Financial liabilities:
Deposits .............................................................. 95,627 95,757
Short-term borrowings ................................................... 3,067 3,067
Long-term borrowings ................................................... 8,110 7,439
Loan commitments and letters of credit ...................................... 117 756
(1) Estimated fair values are consistent with an exit price concept. The assumptions used to estimate the fair
values are intended to approximate those that a market participant would use in a hypothetical orderly
transaction. In estimating fair value, the Company makes adjustments for interest rates, market liquidity and
credit spreads as appropriate.
(2) The estimated fair value of portfolio loans assumes sale of the loans to a third-party financial investor.
Accordingly, the value to the Company if the loans were held to maturity is not reflected in the fair value
estimate. In the current whole loan market, financial investors are generally requiring a higher rate of return
than the return inherent in loans if held to maturity. The fair value discount at December 31, 2011 was $8.1
billion or 11.0 percent.
(3) Excluded from this table is the lease carrying amount of $1.6 billion at December 31, 2011.
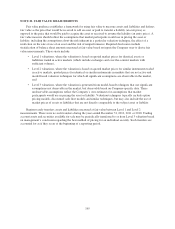
NOTE 22. BUSINESS SEGMENT INFORMATION
Each of Regions’ reportable segments is a strategic business unit that serves specific needs of Regions’
customers based on the products and services provided. The segments are based on the manner in which
management views the financial performance of the business. The Company has three reportable segments:
Business Services, Consumer Services and Wealth Management, with the remainder split between Discontinued
Operations and Other. During the third quarter of 2012, Regions reorganized its internal management structure
and, accordingly, its segment reporting structure. Historically, Regions’ primary business segment was Banking/
Treasury, representing the Company’s banking network (including the Consumer & Commercial Banking
function along with the Treasury function). Other segments included Investment Banking/Brokerage/Trust and
Insurance. During the second quarter of 2012, Regions consummated the sale of Morgan Keegan (the primary
component of Investment Banking/Brokerage/Trust). Shortly thereafter, Regions announced organizational
changes to better integrate and execute the Company’s strategic priorities across all lines of business and
geographies. As a result, Regions revised its reportable segments as described below. Prior periods’ information
has been restated to conform to the current periods’ presentation.
The Business Services segment represents the Company’s commercial banking functions including
commercial and industrial, commercial real estate and investor real estate lending. This segment also includes
equipment lease financing. Business Services customers include corporate, middle market, small business and
commercial real estate developers and investors. Corresponding deposit products related to these types of
customers are included in this segment.
205