Regions Bank 2012 Annual Report Download - page 84
Download and view the complete annual report
Please find page 84 of the 2012 Regions Bank annual report below. You can navigate through the pages in the report by either clicking on the pages listed below, or by using the keyword search tool below to find specific information within the annual report.-
 1
1 -
2
-
3
-
4
-
5
-
6
-
7
-
8
-
9
-
10
-
11
-
12
-
13
-
14
-
15
-
16
-
17
-
18
-
19
-
20
-
21
-
22
-
23
-
24
-
25
-
26
-
27
-
28
-
29
-
30
-
31
-
32
-
33
-
34
-
35
-
36
-
37
-
38
-
39
-
40
-
41
-
42
-
43
-
44
-
45
-
46
-
47
-
48
-
49
-
50
-
51
-
52
-
53
-
54
-
55
-
56
-
57
-
58
-
59
-
60
-
61
-
62
-
63
-
64
-
65
-
66
-
67
-
68
-
69
-
70
-
71
-
72
-
73
-
 74
74 -
 75
75 -
 76
76 -
 77
77 -
 78
78 -
 79
79 -
 80
80 -
 81
81 -
 82
82 -
 83
83 -
 84
84 -
 85
85 -
 86
86 -
 87
87 -
 88
88 -
 89
89 -
 90
90 -
 91
91 -
 92
92 -
 93
93 -
 94
94 -
95
-
96
-
97
-
98
-
99
-
100
-
101
-
102
-
103
-
104
-
105
-
106
-
107
-
108
-
109
-
110
-
111
-
112
-
113
-
114
-
115
-
116
-
117
-
118
-
119
-
120
-
121
-
122
-
123
-
124
-
125
-
126
-
127
-
128
-
129
-
130
-
131
-
132
-
133
-
134
-
135
-
136
-
137
-
138
-
139
-
140
-
141
-
142
-
143
-
144
-
145
-
146
-
147
-
148
-
149
-
150
-
151
-
152
-
153
-
154
-
155
-
156
-
157
-
158
-
159
-
160
-
161
-
162
-
163
-
164
-
165
-
166
-
167
-
168
-
169
-
170
-
171
-
172
-
173
-
174
-
175
-
176
-
177
-
178
-
179
-
180
-
181
-
182
-
183
-
184
-
185
-
186
-
187
-
188
-
189
-
190
-
191
-
192
-
193
-
194
-
195
-
196
-
197
-
198
-
199
-
200
-
201
-
202
-
203
-
204
-
205
-
206
-
207
-
208
-
209
-
210
-
211
-
212
-
213
-
214
-
215
-
216
-
217
-
218
-
219
-
220
-
221
-
222
-
223
-
224
-
225
-
226
-
227
-
228
-
229
-
230
-
231
-
232
-
233
-
234
-
235
-
236
-
237
-
238
-
239
-
240
-
241
-
242
-
243
-
244
-
245
-
246
-
247
-
248
-
249
-
250
-
251
-
252
-
253
-
254
 |
 |

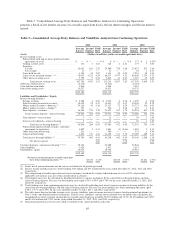
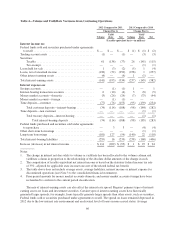
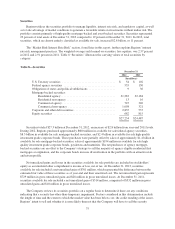
Table 5—Non-Interest Income from Continuing Operations
Year Ended December 31
2012 2011 2010
(In millions)
Service charges on deposit accounts ....................................... $ 985 $1,168 $1,174
Investment fee income .................................................. 110 64 69
Mortgage income ...................................................... 363 220 247
Trust department income ................................................ 195 199 196
Securities gains, net .................................................... 48 112 394
Insurance commissions and fees .......................................... 109 106 104
Leveraged lease termination gains ......................................... 14 8 78
Commercial credit fee income ............................................ 68 80 76
Bank-owned life insurance ............................................... 81 83 88
Net loss from affordable housing .......................................... (49) (69) (72)
Credit card / bank card income ........................................... 85 65 31
Other miscellaneous income ............................................. 91 107 104
$2,100 $2,143 $2,489
Service Charges on Deposit Accounts
Income from service charges on deposit accounts decreased 16 percent in 2012 and totaled $985 million and
$1.2 billion in 2012 and 2011, respectively. The decrease was primarily driven by policy changes negatively
impacting non-sufficient fund fees related to Regulation E, as well as a decline in interchange income as a result
of debit interchange price controls implemented in the fourth quarter of 2011. During 2012, service charges on
deposit accounts were also negatively impacted by a total of approximately $35 million in customer refunds
resulting from a change in the Company’s non-sufficient funds policy.
Interchange income, which is included in service charges on deposit accounts, was impacted by the Federal
Reserve’s rulemaking required by section 1075 of the Dodd-Frank Act. The Federal Reserve Board of Governors
announced its final rule on debit card interchange fees mandated by the Durbin Amendment to the Dodd-Frank
Act effective October 1, 2011, which contributed to the decline in service charges in 2012.
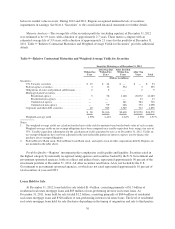
Investment Fee and Trust Department Income
Total investment fee income, which primarily relates to capital markets activities such as loan syndications,
foreign exchange and derivatives, increased 72 percent to $110 million in 2012 from $64 million in 2011, due
primarily to improved market valuations in the customer derivative portfolio. Trust department income decreased
2 percent to $195 million in 2012, driven by declines in assets under management to approximately $72.7 billion
at year-end 2012 compared to approximately $74.6 billion at year-end 2011.
Mortgage Income
Mortgage income is generated through the origination and servicing of mortgage loans for long-term
investors and sales of mortgage loans in the secondary market. Mortgage income increased $143 million or
65 percent to $363 million in 2012. The increase reflects wider margins as a result of favorable market
conditions, as well as an increase in originations driven by customers taking advantage of the opportunity to
refinance under the extended Home Affordable Refinance Program, or HARP II. Mortgage originations totaled
$8.0 billion in 2012 as compared to $6.3 billion in 2011. In 2012, refinancing encompassed 63 percent of
mortgage originations versus 54 percent in 2011.
At December 31, 2012, $26.2 billion of Regions’ servicing portfolio was serviced for third parties. At
December 31, 2011, $26.7 billion of the servicing portfolio was serviced for third parties.
68