Regions Bank 2012 Annual Report Download - page 175
Download and view the complete annual report
Please find page 175 of the 2012 Regions Bank annual report below. You can navigate through the pages in the report by either clicking on the pages listed below, or by using the keyword search tool below to find specific information within the annual report.-
 1
1 -
2
-
3
-
4
-
5
-
6
-
7
-
8
-
9
-
10
-
11
-
12
-
13
-
14
-
15
-
16
-
17
-
18
-
19
-
20
-
21
-
22
-
23
-
24
-
25
-
26
-
27
-
28
-
29
-
30
-
31
-
32
-
33
-
34
-
35
-
36
-
37
-
38
-
39
-
40
-
41
-
42
-
43
-
44
-
45
-
46
-
47
-
48
-
49
-
50
-
51
-
52
-
53
-
54
-
55
-
56
-
57
-
58
-
59
-
60
-
61
-
62
-
63
-
64
-
65
-
66
-
67
-
68
-
69
-
70
-
71
-
72
-
73
-
74
-
75
-
76
-
77
-
78
-
79
-
80
-
81
-
82
-
83
-
84
-
85
-
86
-
87
-
88
-
89
-
90
-
91
-
92
-
93
-
94
-
95
-
96
-
97
-
98
-
99
-
100
-
101
-
102
-
103
-
104
-
105
-
106
-
107
-
108
-
109
-
110
-
111
-
112
-
113
-
114
-
115
-
116
-
117
-
118
-
119
-
120
-
121
-
122
-
123
-
124
-
125
-
126
-
127
-
128
-
129
-
130
-
131
-
132
-
133
-
134
-
135
-
136
-
137
-
138
-
139
-
140
-
141
-
142
-
143
-
144
-
145
-
146
-
147
-
148
-
149
-
150
-
151
-
152
-
153
-
154
-
155
-
156
-
157
-
158
-
159
-
160
-
161
-
162
-
163
-
164
-
 165
165 -
 166
166 -
 167
167 -
 168
168 -
 169
169 -
 170
170 -
 171
171 -
 172
172 -
 173
173 -
 174
174 -
 175
175 -
 176
176 -
 177
177 -
 178
178 -
 179
179 -
 180
180 -
 181
181 -
 182
182 -
 183
183 -
 184
184 -
 185
185 -
186
-
187
-
188
-
189
-
190
-
191
-
192
-
193
-
194
-
195
-
196
-
197
-
198
-
199
-
200
-
201
-
202
-
203
-
204
-
205
-
206
-
207
-
208
-
209
-
210
-
211
-
212
-
213
-
214
-
215
-
216
-
217
-
218
-
219
-
220
-
221
-
222
-
223
-
224
-
225
-
226
-
227
-
228
-
229
-
230
-
231
-
232
-
233
-
234
-
235
-
236
-
237
-
238
-
239
-
240
-
241
-
242
-
243
-
244
-
245
-
246
-
247
-
248
-
249
-
250
-
251
-
252
-
253
-
254
 |
 |

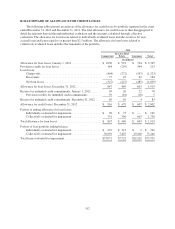
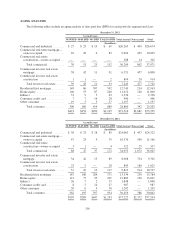
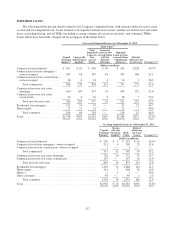
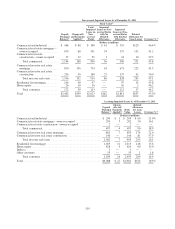
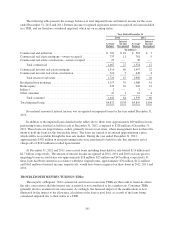
Non-accrual Impaired Loans As of December 31, 2011
Book Value(3)
Unpaid
Principal
Balance(1)
Charge-offs
and Payments
Applied(2)
Total
Impaired
Loans on
Non-
accrual
Status
Impaired
Loans on Non-
accrual Status
with No
Related
Allowance
Impaired
Loans on Non-
accrual Status
with Related
Allowance
Related
Allowance for
Loan Losses Coverage %(4)
(Dollars in millions)
Commercial and industrial ........ $ 468 $ 88 $ 380 $ 61 $ 319 $129 46.4%
Commercial real estate mortgage—
owner-occupied ............... 679 88 591 34 557 192 41.2
Commercial real estate
construction—owner-occupied . . . 37 12 25 1 24 10 59.5
Total commercial ........... 1,184 188 996 96 900 331 43.8
Commercial investor real estate
mortgage .................... 870 136 734 63 671 223 41.3
Commercial investor real estate
construction ................. 236 56 180 23 157 62 50.0
Total investor real estate ...... 1,106 192 914 86 828 285 43.1
Residential first mortgage ......... 146 49 97 — 97 15 43.8
Home equity ................... 26 10 16 — 16 2 46.2
Total consumer ............. 172 59 113 — 113 17 44.2
Total ......................... $2,462 $439 $2,023 $182 $1,841 $633 43.5%
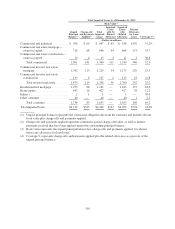
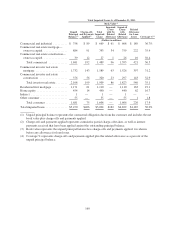
Accruing Impaired Loans As of December 31, 2011
Unpaid
Principal
Balance(1)
Charge-
offs and
Payments
Applied(2)
Book
Value
Related
Allowance
for Loan
Losses Coverage %(4)
(Dollars in millions)
Commercial and industrial ...................................... $ 290 $ 1 $ 289 $ 60 21.0%
Commercial real estate mortgage—owner-occupied .................. 205 3 202 30 16.1
Commercial real estate construction—owner-occupied ............... 2 — 2 — —
Total commercial ......................................... 497 4 493 90 18.9
Commercial investor real estate mortgage .......................... 862 7 855 174 21.0
Commercial investor real estate construction ....................... 140 — 140 81 57.9
Total investor real estate ................................... 1,002 7 995 255 26.1
Residential first mortgage ...................................... 1,025 12 1,013 148 15.6
Home equity ................................................. 428 4 424 60 15.0
Indirect ..................................................... 1 — 1 — —
Other consumer .............................................. 55 — 55 1 1.8
Total consumer ........................................... 1,509 16 1,493 209 14.9
Total ....................................................... $3,008 $ 27 $2,981 $554 19.3%
159