Regions Bank 2012 Annual Report Download - page 149
Download and view the complete annual report
Please find page 149 of the 2012 Regions Bank annual report below. You can navigate through the pages in the report by either clicking on the pages listed below, or by using the keyword search tool below to find specific information within the annual report.-
 1
1 -
2
-
3
-
4
-
5
-
6
-
7
-
8
-
9
-
10
-
11
-
12
-
13
-
14
-
15
-
16
-
17
-
18
-
19
-
20
-
21
-
22
-
23
-
24
-
25
-
26
-
27
-
28
-
29
-
30
-
31
-
32
-
33
-
34
-
35
-
36
-
37
-
38
-
39
-
40
-
41
-
42
-
43
-
44
-
45
-
46
-
47
-
48
-
49
-
50
-
51
-
52
-
53
-
54
-
55
-
56
-
57
-
58
-
59
-
60
-
61
-
62
-
63
-
64
-
65
-
66
-
67
-
68
-
69
-
70
-
71
-
72
-
73
-
74
-
75
-
76
-
77
-
78
-
79
-
80
-
81
-
82
-
83
-
84
-
85
-
86
-
87
-
88
-
89
-
90
-
91
-
92
-
93
-
94
-
95
-
96
-
97
-
98
-
99
-
100
-
101
-
102
-
103
-
104
-
105
-
106
-
107
-
108
-
109
-
110
-
111
-
112
-
113
-
114
-
115
-
116
-
117
-
118
-
119
-
120
-
121
-
122
-
123
-
124
-
125
-
126
-
127
-
128
-
129
-
130
-
131
-
132
-
133
-
134
-
135
-
136
-
137
-
138
-
 139
139 -
 140
140 -
 141
141 -
 142
142 -
 143
143 -
 144
144 -
 145
145 -
 146
146 -
 147
147 -
 148
148 -
 149
149 -
 150
150 -
 151
151 -
 152
152 -
 153
153 -
 154
154 -
 155
155 -
 156
156 -
 157
157 -
 158
158 -
 159
159 -
160
-
161
-
162
-
163
-
164
-
165
-
166
-
167
-
168
-
169
-
170
-
171
-
172
-
173
-
174
-
175
-
176
-
177
-
178
-
179
-
180
-
181
-
182
-
183
-
184
-
185
-
186
-
187
-
188
-
189
-
190
-
191
-
192
-
193
-
194
-
195
-
196
-
197
-
198
-
199
-
200
-
201
-
202
-
203
-
204
-
205
-
206
-
207
-
208
-
209
-
210
-
211
-
212
-
213
-
214
-
215
-
216
-
217
-
218
-
219
-
220
-
221
-
222
-
223
-
224
-
225
-
226
-
227
-
228
-
229
-
230
-
231
-
232
-
233
-
234
-
235
-
236
-
237
-
238
-
239
-
240
-
241
-
242
-
243
-
244
-
245
-
246
-
247
-
248
-
249
-
250
-
251
-
252
-
253
-
254
 |
 |
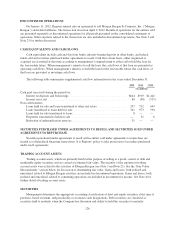
INTANGIBLE ASSETS
Intangible assets include goodwill, which is the excess of cost over the fair value of net assets of acquired
businesses, and other identifiable intangible assets. Other identifiable intangible assets include the following:
1) core deposit intangible assets, which are amounts recorded related to the value of acquired indeterminate-
maturity deposits, 2) amounts capitalized related to the value of acquired customer relationships, and 3) amounts
recorded related to employment agreements with certain individuals of acquired entities. Core deposit intangibles
and most other identifiable intangibles are amortized on an accelerated basis over their expected useful lives.
The Company’s goodwill is tested for impairment on an annual basis in the fourth quarter, or more often if
events or circumstances indicate that there may be impairment. Regions assesses the following indicators of
goodwill impairment for each reporting period:
• Recent operating performance,
• Changes in market capitalization,
• Regulatory actions and assessments,
• Changes in the business climate (including legislation, legal factors and competition),
• Company-specific factors (including changes in key personnel, asset impairments, and business
dispositions), and
• Trends in the banking industry.
Adverse changes in the economic environment, declining operations, or other factors could result in a
decline in the implied fair value of goodwill. A goodwill impairment test includes two steps. Step One, used to
identify potential impairment, compares the estimated fair value of a reporting unit with its carrying amount,
including goodwill. If the estimated fair value of a reporting unit exceeds its carrying amount, goodwill of the
reporting unit is considered not impaired. If the carrying amount of a reporting unit exceeds its estimated fair
value, the second step of the goodwill impairment test is performed to measure the amount of impairment loss, if
any. Step Two of the goodwill impairment test compares the implied estimated fair value of reporting unit
goodwill with the carrying amount of that goodwill. If the carrying amount of goodwill for that reporting unit
exceeds the implied fair value of that unit’s goodwill, an impairment loss is recognized in other non-interest
expense in an amount equal to that excess.
For purposes of performing Step One of the goodwill impairment test, Regions uses both income and market
approaches to value its reporting units. The income approach, which is the primary valuation approach, consists
of discounting projected long-term future cash flows, which are derived from internal forecasts and economic
expectations for the respective reporting units. The significant inputs to the income approach include expected
future cash flows, the long-term target equity ratios, and the discount rate.
Regions utilizes the capital asset pricing model (“CAPM”) in order to derive the base discount rate. The
inputs to the CAPM include the 20-year risk-free rate, 5-year beta for a select peer set, and the market risk
premium based on published data. Once the output of the CAPM is determined, a size premium is added (also
based on a published source) as well as a company-specific risk premium (based on business model and market
perception of risk) for each reporting unit.
Regions uses the guideline public company method and the guideline transaction method as the two market
approaches. The public company method applies a value multiplier derived from each reporting unit’s peer group
to tangible book value or price to earnings ratios (for Wealth Management) and an implied control premium to
the respective reporting unit. The control premium is evaluated and compared to similar financial services
transactions considering the absolute and relative potential revenue synergies and cost savings. The transaction
method applies a value multiplier to a financial metric of the reporting unit based on comparable observed
purchase transactions in the financial services industry for the reporting unit (where available).
133