Regions Bank 2012 Annual Report Download - page 142
Download and view the complete annual report
Please find page 142 of the 2012 Regions Bank annual report below. You can navigate through the pages in the report by either clicking on the pages listed below, or by using the keyword search tool below to find specific information within the annual report.-
 1
1 -
2
-
3
-
4
-
5
-
6
-
7
-
8
-
9
-
10
-
11
-
12
-
13
-
14
-
15
-
16
-
17
-
18
-
19
-
20
-
21
-
22
-
23
-
24
-
25
-
26
-
27
-
28
-
29
-
30
-
31
-
32
-
33
-
34
-
35
-
36
-
37
-
38
-
39
-
40
-
41
-
42
-
43
-
44
-
45
-
46
-
47
-
48
-
49
-
50
-
51
-
52
-
53
-
54
-
55
-
56
-
57
-
58
-
59
-
60
-
61
-
62
-
63
-
64
-
65
-
66
-
67
-
68
-
69
-
70
-
71
-
72
-
73
-
74
-
75
-
76
-
77
-
78
-
79
-
80
-
81
-
82
-
83
-
84
-
85
-
86
-
87
-
88
-
89
-
90
-
91
-
92
-
93
-
94
-
95
-
96
-
97
-
98
-
99
-
100
-
101
-
102
-
103
-
104
-
105
-
106
-
107
-
108
-
109
-
110
-
111
-
112
-
113
-
114
-
115
-
116
-
117
-
118
-
119
-
120
-
121
-
122
-
123
-
124
-
125
-
126
-
127
-
128
-
129
-
130
-
131
-
 132
132 -
 133
133 -
 134
134 -
 135
135 -
 136
136 -
 137
137 -
 138
138 -
 139
139 -
 140
140 -
 141
141 -
 142
142 -
 143
143 -
 144
144 -
 145
145 -
 146
146 -
 147
147 -
 148
148 -
 149
149 -
 150
150 -
 151
151 -
 152
152 -
153
-
154
-
155
-
156
-
157
-
158
-
159
-
160
-
161
-
162
-
163
-
164
-
165
-
166
-
167
-
168
-
169
-
170
-
171
-
172
-
173
-
174
-
175
-
176
-
177
-
178
-
179
-
180
-
181
-
182
-
183
-
184
-
185
-
186
-
187
-
188
-
189
-
190
-
191
-
192
-
193
-
194
-
195
-
196
-
197
-
198
-
199
-
200
-
201
-
202
-
203
-
204
-
205
-
206
-
207
-
208
-
209
-
210
-
211
-
212
-
213
-
214
-
215
-
216
-
217
-
218
-
219
-
220
-
221
-
222
-
223
-
224
-
225
-
226
-
227
-
228
-
229
-
230
-
231
-
232
-
233
-
234
-
235
-
236
-
237
-
238
-
239
-
240
-
241
-
242
-
243
-
244
-
245
-
246
-
247
-
248
-
249
-
250
-
251
-
252
-
253
-
254
 |
 |

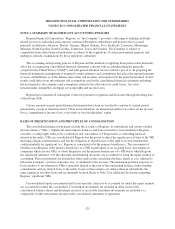
DISCONTINUED OPERATIONS
On January 11, 2012, Regions entered into an agreement to sell Morgan Keegan & Company, Inc. (“Morgan
Keegan”) and related affiliates. The transaction closed on April 2, 2012. Results of operations for the entities sold
are presented separately as discontinued operations for all periods presented on the consolidated statements of
operations. Other expenses related to the transaction are also included in discontinued operations. See Note 3 and
Note 23 for further discussion.
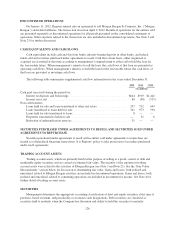
CASH EQUIVALENTS AND CASH FLOWS
Cash equivalents include cash and due from banks, interest-bearing deposits in other banks, and federal
funds sold and securities purchased under agreements to resell. Cash flows from loans, either originated or
acquired, are classified at that time according to management’s original intent to either sell or hold the loan for
the foreseeable future. When management’s intent is to sell the loan, the cash flows of that loan are presented as
operating cash flows. When management’s intent is to hold the loan for the foreseeable future, the cash flows of
that loan are presented as investing cash flows.
The following table summarizes supplemental cash flow information for the years ended December 31:
2012 2011 2010
(In millions)
Cash paid (received) during the period for:
Interest on deposits and borrowings ....................................... $644 $919 $1,442
Income taxes, net ..................................................... 80 (98) (555)
Non-cash transfers:
Loans held for sale and loans transferred to other real estate ................... 297 532 649
Loans transferred to loans held for sale .................................... 341 973 594
Loans held for sale transferred to loans .................................... 8 — —
Properties transferred to held for sale ..................................... — 51 6
Reduction of indemnification reserves ..................................... 51 — —
SECURITIES PURCHASED UNDER AGREEMENTS TO RESELL AND SECURITIES SOLD UNDER
AGREEMENTS TO REPURCHASE
Securities purchased under agreements to resell and securities sold under agreements to repurchase are
treated as collateralized financing transactions. It is Regions’ policy to take possession of securities purchased
under resell agreements.
TRADING ACCOUNT ASSETS
Trading account assets, which are primarily held for the purpose of selling at a profit, consist of debt and
marketable equity securities and are carried at estimated fair value. The majority of the amounts in trading
account assets were related to the activities of Morgan Keegan (see Note 3 and Note 23). See the “Fair Value
Measurements” section below for discussion of determining fair value. Gains and losses, both realized and
unrealized, related to Morgan Keegan activities are included in discontinued operations. Gains and losses, both
realized and unrealized, related to continuing operations are included in investment fee income. See Note 4 for
further detail of trading account assets.
SECURITIES
Management determines the appropriate accounting classification of debt and equity securities at the time of
purchase, based on intent, and periodically re-evaluates such designations. Debt securities are classified as
securities held to maturity when the Company has the intent and ability to hold the securities to maturity.
126