Regions Bank 2012 Annual Report Download - page 214
Download and view the complete annual report
Please find page 214 of the 2012 Regions Bank annual report below. You can navigate through the pages in the report by either clicking on the pages listed below, or by using the keyword search tool below to find specific information within the annual report.-
 1
1 -
2
-
3
-
4
-
5
-
6
-
7
-
8
-
9
-
10
-
11
-
12
-
13
-
14
-
15
-
16
-
17
-
18
-
19
-
20
-
21
-
22
-
23
-
24
-
25
-
26
-
27
-
28
-
29
-
30
-
31
-
32
-
33
-
34
-
35
-
36
-
37
-
38
-
39
-
40
-
41
-
42
-
43
-
44
-
45
-
46
-
47
-
48
-
49
-
50
-
51
-
52
-
53
-
54
-
55
-
56
-
57
-
58
-
59
-
60
-
61
-
62
-
63
-
64
-
65
-
66
-
67
-
68
-
69
-
70
-
71
-
72
-
73
-
74
-
75
-
76
-
77
-
78
-
79
-
80
-
81
-
82
-
83
-
84
-
85
-
86
-
87
-
88
-
89
-
90
-
91
-
92
-
93
-
94
-
95
-
96
-
97
-
98
-
99
-
100
-
101
-
102
-
103
-
104
-
105
-
106
-
107
-
108
-
109
-
110
-
111
-
112
-
113
-
114
-
115
-
116
-
117
-
118
-
119
-
120
-
121
-
122
-
123
-
124
-
125
-
126
-
127
-
128
-
129
-
130
-
131
-
132
-
133
-
134
-
135
-
136
-
137
-
138
-
139
-
140
-
141
-
142
-
143
-
144
-
145
-
146
-
147
-
148
-
149
-
150
-
151
-
152
-
153
-
154
-
155
-
156
-
157
-
158
-
159
-
160
-
161
-
162
-
163
-
164
-
165
-
166
-
167
-
168
-
169
-
170
-
171
-
172
-
173
-
174
-
175
-
176
-
177
-
178
-
179
-
180
-
181
-
182
-
183
-
184
-
185
-
186
-
187
-
188
-
189
-
190
-
191
-
192
-
193
-
194
-
195
-
196
-
197
-
198
-
199
-
200
-
201
-
202
-
203
-
 204
204 -
 205
205 -
 206
206 -
 207
207 -
 208
208 -
 209
209 -
 210
210 -
 211
211 -
 212
212 -
 213
213 -
 214
214 -
 215
215 -
 216
216 -
 217
217 -
 218
218 -
 219
219 -
 220
220 -
 221
221 -
 222
222 -
 223
223 -
 224
224 -
225
-
226
-
227
-
228
-
229
-
230
-
231
-
232
-
233
-
234
-
235
-
236
-
237
-
238
-
239
-
240
-
241
-
242
-
243
-
244
-
245
-
246
-
247
-
248
-
249
-
250
-
251
-
252
-
253
-
254
 |
 |

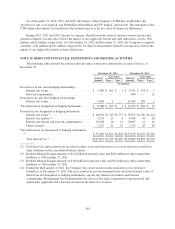
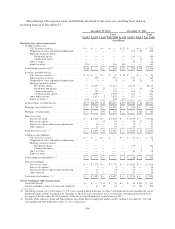
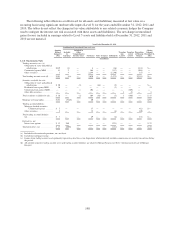
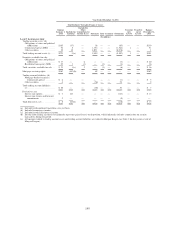
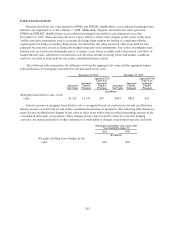
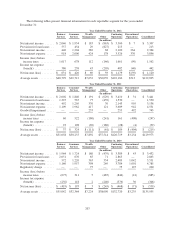
The following tables illustrate a rollforward for all assets and (liabilities) measured at fair value on a
recurring basis using significant unobservable inputs (Level 3) for the years ended December 31, 2012, 2011 and
2010. The tables do not reflect the change in fair value attributable to any related economic hedges the Company
used to mitigate the interest rate risk associated with these assets and (liabilities). The net change in unrealized
gains (losses) included in earnings related to Level 3 assets and liabilities held at December 31, 2012, 2011 and
2010 are not material.
Year Ended December 31, 2012
Total Realized /Unrealized Gains or Losses
Opening
Balance
January 1,
2012
Included
in
Earnings
Included in
Other
Comprehensive
Income (Loss) Purchases Sales Issuances Settlements
Transfers
into
Level 3
Transfers
out of
Level 3
Disposition
of Morgan
Keegan
Closing
Balance
December 31,
2012
(In millions)
Level 3 Instruments Only
Trading account assets: (c)
Obligations of states and political
subdivisions ............... $139 (3) — 4 — — (16) — — (124) $—
Commercial agency MBS ...... 51 2 — 368 — — (317) — — (104) —
Other securities ............... 1 4 — 2,248 — — (2,240) — — (13) —
Total trading account assets (d) .... $191 3(a) — 2,620 — — (2,573) — — $(241) $—
Securities available for sale:
Obligations of states and political
subdivisions ............... $ 20 — (2) — (16) — (2) — — — $—
Residential non-agency MBS .... 16 — — — — — (3) — — — 13
Commercial non-agency MBS . . . — — 1 104 — — — — (105) — —
Other debt securities ........... — — — — — — — 3 (1) — 2
Total securities available for sale . . . $ 36 — (1) 104 (16) — (5) 3 (106) — $ 15
Mortgage servicing rights ......... $182 (51)(b) — 60 — — — — — — $191
Trading account liabilities:
Mortgage-backed securities:
Commercial agency ....... $ 5 — — 37 — — — — — (42) $—
Other securities ............... 2 — — 12 — — (4) — — (10) —
Total trading account liabilities
(d) ......................... $ 7 — — 49 — — (4) — — (52) $—
Derivatives, net:
Interest rate options ........... $ 13 240 — — — — (231) — — — $ 22
Total derivatives, net ............ $ 13 240(b) — — — — (231) — — — $ 22
(a) Included in discontinued operations, on a net basis.
(b) Included in mortgage income.
(c) Income from trading account assets primarily represents gains/(losses) on disposition, which inherently includes commissions on security transactions during
the period.
(d) All amounts related to trading account assets and trading account liabilities are related to Morgan Keegan (see Note 3 for discussion of sale of Morgan
Keegan).
198