Regions Bank 2012 Annual Report Download - page 63
Download and view the complete annual report
Please find page 63 of the 2012 Regions Bank annual report below. You can navigate through the pages in the report by either clicking on the pages listed below, or by using the keyword search tool below to find specific information within the annual report.-
 1
1 -
2
-
3
-
4
-
5
-
6
-
7
-
8
-
9
-
10
-
11
-
12
-
13
-
14
-
15
-
16
-
17
-
18
-
19
-
20
-
21
-
22
-
23
-
24
-
25
-
26
-
27
-
28
-
29
-
30
-
31
-
32
-
33
-
34
-
35
-
36
-
37
-
38
-
39
-
40
-
41
-
42
-
43
-
44
-
45
-
46
-
47
-
48
-
49
-
50
-
51
-
52
-
 53
53 -
 54
54 -
 55
55 -
 56
56 -
 57
57 -
 58
58 -
 59
59 -
 60
60 -
 61
61 -
 62
62 -
 63
63 -
 64
64 -
 65
65 -
 66
66 -
 67
67 -
 68
68 -
 69
69 -
 70
70 -
 71
71 -
 72
72 -
 73
73 -
74
-
75
-
76
-
77
-
78
-
79
-
80
-
81
-
82
-
83
-
84
-
85
-
86
-
87
-
88
-
89
-
90
-
91
-
92
-
93
-
94
-
95
-
96
-
97
-
98
-
99
-
100
-
101
-
102
-
103
-
104
-
105
-
106
-
107
-
108
-
109
-
110
-
111
-
112
-
113
-
114
-
115
-
116
-
117
-
118
-
119
-
120
-
121
-
122
-
123
-
124
-
125
-
126
-
127
-
128
-
129
-
130
-
131
-
132
-
133
-
134
-
135
-
136
-
137
-
138
-
139
-
140
-
141
-
142
-
143
-
144
-
145
-
146
-
147
-
148
-
149
-
150
-
151
-
152
-
153
-
154
-
155
-
156
-
157
-
158
-
159
-
160
-
161
-
162
-
163
-
164
-
165
-
166
-
167
-
168
-
169
-
170
-
171
-
172
-
173
-
174
-
175
-
176
-
177
-
178
-
179
-
180
-
181
-
182
-
183
-
184
-
185
-
186
-
187
-
188
-
189
-
190
-
191
-
192
-
193
-
194
-
195
-
196
-
197
-
198
-
199
-
200
-
201
-
202
-
203
-
204
-
205
-
206
-
207
-
208
-
209
-
210
-
211
-
212
-
213
-
214
-
215
-
216
-
217
-
218
-
219
-
220
-
221
-
222
-
223
-
224
-
225
-
226
-
227
-
228
-
229
-
230
-
231
-
232
-
233
-
234
-
235
-
236
-
237
-
238
-
239
-
240
-
241
-
242
-
243
-
244
-
245
-
246
-
247
-
248
-
249
-
250
-
251
-
252
-
253
-
254
 |
 |
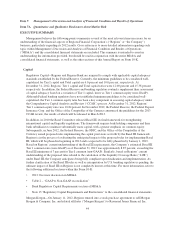
• Credit Risk section of MD&A
• Note 6 “Allowance for Credit Losses” to the consolidated financial statements
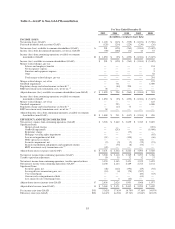
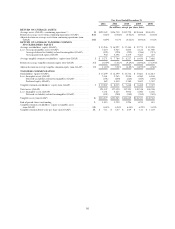
Net Interest Income, Margin and Interest Rate Risk
In 2012, the net interest margin from continuing operations expanded to 3.11 percent from 3.07 percent
in 2011, largely due to a mix shift from time deposits to lower cost deposit products, resulting in deposit
costs decreasing to 0.30 percent in 2012 from 0.49 percent in 2011. Taxable-equivalent net interest income
decreased $95 million to $3.4 billion in 2012, due primarily to a reduction in average earning assets from
$112.2 billion in 2011 to $107.8 billion in 2012. Despite the continued improvements in deposit costs and
mix, the margin and net interest income continue to be negatively affected by a sustained low interest rate,
low growth environment. Reductions in average loans contributed to the decline in average earning assets
and net interest income, partially offset by an increase in average securities from $24.6 billion in 2011 to
$26.7 billion in 2012. The Company’s securities yield declined 53 basis points driven by higher
prepayments in the residential mortgage-backed securities portfolio and reinvestment of proceeds into lower
yielding securities. Loan yields, however, remained relatively stable at 4.24 percent as the Company began
to see the benefits from migrating toward more consumer products, such as expanding indirect auto lending
and re-entering credit cards, as well as reductions in the Company’s level of non-accrual loans. If current
economic conditions persist into 2013, growing net interest income and the resulting net interest margin will
continue to be challenging. However, management believes opportunities exist to maintain a relatively
stable margin through further reducing deposit costs and additional liability management actions. Regions’
balance sheet is in a moderately asset sensitive position such that if economic conditions were to improve
more rapidly, thereby resulting in a rise in interest rates, the net interest margin would likely respond
favorably. For more information, refer to the following additional sections within this Form 10-K:
• 2012 Overview discussion in MD&A
• Net Interest Income and Margin section of MD&A
• Interest Rate Risk section of MD&A
GENERAL
The following discussion and financial information is presented to aid in understanding Regions’ financial
position and results of operations. The emphasis of this discussion will be on continuing operations for the years
2012, 2011 and 2010; in addition, financial information for prior years will also be presented when appropriate.
Certain amounts in prior year presentations have been reclassified to conform to the current year presentation,
except as otherwise noted.
Regions’ profitability, like that of many other financial institutions, is dependent on its ability to generate
revenue from net interest income and non-interest income sources. Net interest income is the difference between
the interest income Regions receives on interest-earning assets, such as loans and securities, and the interest
expense Regions pays on interest-bearing liabilities, principally deposits and borrowings. Regions’ net interest
income is impacted by the size and mix of its balance sheet components and the interest rate spread between
interest earned on its assets and interest paid on its liabilities. Non-interest income includes fees from service
charges on deposit accounts, mortgage servicing and secondary marketing, trust and asset management activities,
insurance activities, capital markets and other customer services, which Regions provides. Results of operations
are also affected by the provision for loan losses and non-interest expenses such as salaries and employee
benefits, occupancy, professional fees, FDIC insurance, other real estate owned and other operating expenses, as
well as income taxes.
Economic conditions, competition, new legislation and related rules impacting regulation of the financial
services industry and the monetary and fiscal policies of the Federal government significantly affect financial
47