Regions Bank 2012 Annual Report Download - page 217
Download and view the complete annual report
Please find page 217 of the 2012 Regions Bank annual report below. You can navigate through the pages in the report by either clicking on the pages listed below, or by using the keyword search tool below to find specific information within the annual report.-
 1
1 -
2
-
3
-
4
-
5
-
6
-
7
-
8
-
9
-
10
-
11
-
12
-
13
-
14
-
15
-
16
-
17
-
18
-
19
-
20
-
21
-
22
-
23
-
24
-
25
-
26
-
27
-
28
-
29
-
30
-
31
-
32
-
33
-
34
-
35
-
36
-
37
-
38
-
39
-
40
-
41
-
42
-
43
-
44
-
45
-
46
-
47
-
48
-
49
-
50
-
51
-
52
-
53
-
54
-
55
-
56
-
57
-
58
-
59
-
60
-
61
-
62
-
63
-
64
-
65
-
66
-
67
-
68
-
69
-
70
-
71
-
72
-
73
-
74
-
75
-
76
-
77
-
78
-
79
-
80
-
81
-
82
-
83
-
84
-
85
-
86
-
87
-
88
-
89
-
90
-
91
-
92
-
93
-
94
-
95
-
96
-
97
-
98
-
99
-
100
-
101
-
102
-
103
-
104
-
105
-
106
-
107
-
108
-
109
-
110
-
111
-
112
-
113
-
114
-
115
-
116
-
117
-
118
-
119
-
120
-
121
-
122
-
123
-
124
-
125
-
126
-
127
-
128
-
129
-
130
-
131
-
132
-
133
-
134
-
135
-
136
-
137
-
138
-
139
-
140
-
141
-
142
-
143
-
144
-
145
-
146
-
147
-
148
-
149
-
150
-
151
-
152
-
153
-
154
-
155
-
156
-
157
-
158
-
159
-
160
-
161
-
162
-
163
-
164
-
165
-
166
-
167
-
168
-
169
-
170
-
171
-
172
-
173
-
174
-
175
-
176
-
177
-
178
-
179
-
180
-
181
-
182
-
183
-
184
-
185
-
186
-
187
-
188
-
189
-
190
-
191
-
192
-
193
-
194
-
195
-
196
-
197
-
198
-
199
-
200
-
201
-
202
-
203
-
204
-
205
-
206
-
 207
207 -
 208
208 -
 209
209 -
 210
210 -
 211
211 -
 212
212 -
 213
213 -
 214
214 -
 215
215 -
 216
216 -
 217
217 -
 218
218 -
 219
219 -
 220
220 -
 221
221 -
 222
222 -
 223
223 -
 224
224 -
 225
225 -
 226
226 -
 227
227 -
228
-
229
-
230
-
231
-
232
-
233
-
234
-
235
-
236
-
237
-
238
-
239
-
240
-
241
-
242
-
243
-
244
-
245
-
246
-
247
-
248
-
249
-
250
-
251
-
252
-
253
-
254
 |
 |

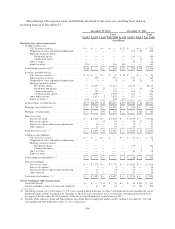
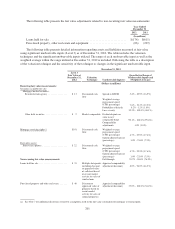
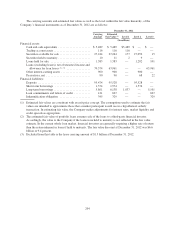
The following table presents the fair value adjustments related to non-recurring fair value measurements:
Year Ended
December 31
2012 2011
(In millions)
Loans held for sale .................................................... $(174) $(611)
Foreclosed property, other real estate and equipment ......................... (66) (229)
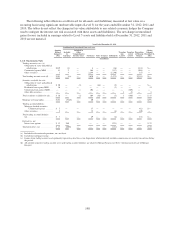
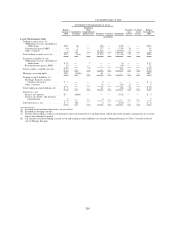
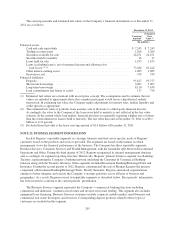
The following table presents detailed information regarding assets and liabilities measured at fair value
using significant unobservable inputs (Level 3) as of December 31, 2012. The table includes the valuation
techniques and the significant unobservable inputs utilized. The range of each unobservable input as well as the
weighted average within the range utilized at December 31, 2012 is included. Following the table is a description
of the valuation technique and the sensitivity of the technique to changes in the significant unobservable input.
December 31, 2012
Level 3
Fair Value at
December 31,
2012
Valuation
Technique Unobservable Input(s)
Quantitative Range of
Unobservable Inputs and
(Weighted-Average)
(Dollars in millions)
Recurring fair value measurements:
Securities available for sale:
Mortgage-backed securities:
Residential non-agency ................ $ 13 Discounted cash
flow
Spread to LIBOR 5.4% - 69.9% (16.9%)
Weighted-average
prepayment speed
(CPR; percentage) 7.6% - 30.3% (12.2%)
Probability of default 0.2% - 1.2% (1.0%)
Loss severity 39.3% - 100.0% (48.1%)
Other debt securities .................. $ 2 Market comparable Evaluated quote on
same issuer/
comparable bond 99.1% - 100.0% (99.6%)
Comparability
adjustments 1.0% (1.0%)
Mortgage servicing rights (a) $191 Discounted cash
flow
Weighted-average
prepayment speed
(CPR; percentage) 4.7% - 25.9% (17.6%)
Option-adjusted spread
(percentage) 1.0% - 23.6% (7.5%)
Derivative assets:
Interest rate options ..................... $ 22 Discounted cash
flow
Weighted-average
prepayment speed
(CPR; percentage) 4.7% - 25.9% (17.6%)
Option-adjusted spread
(percentage) 1.0% - 23.6% (7.5%)
Nonrecurring fair value measurements: Pull-through 55.7% - 98.8% (76.9%)
Loans held for sale ........................ $ 51 Multiple data points,
including discount
to appraised value
of collateral based
on recent market
activity for sales of
similar loans
Appraisal comparability
adjustment (discount) 8.0% - 94.0% (46.3%)
Foreclosed property and other real estate ...... $ 40 Discount to
appraised value of
property based on
recent market
activity for sales of
similar properties
Appraisal comparability
adjustment (discount) 35.0% - 100.0% (36.2%)
(a) See Note 7 for additional disclosures related to assumptions used in the fair value calculation for mortgage servicing rights.
201