Regions Bank 2012 Annual Report Download - page 189
Download and view the complete annual report
Please find page 189 of the 2012 Regions Bank annual report below. You can navigate through the pages in the report by either clicking on the pages listed below, or by using the keyword search tool below to find specific information within the annual report.-
 1
1 -
2
-
3
-
4
-
5
-
6
-
7
-
8
-
9
-
10
-
11
-
12
-
13
-
14
-
15
-
16
-
17
-
18
-
19
-
20
-
21
-
22
-
23
-
24
-
25
-
26
-
27
-
28
-
29
-
30
-
31
-
32
-
33
-
34
-
35
-
36
-
37
-
38
-
39
-
40
-
41
-
42
-
43
-
44
-
45
-
46
-
47
-
48
-
49
-
50
-
51
-
52
-
53
-
54
-
55
-
56
-
57
-
58
-
59
-
60
-
61
-
62
-
63
-
64
-
65
-
66
-
67
-
68
-
69
-
70
-
71
-
72
-
73
-
74
-
75
-
76
-
77
-
78
-
79
-
80
-
81
-
82
-
83
-
84
-
85
-
86
-
87
-
88
-
89
-
90
-
91
-
92
-
93
-
94
-
95
-
96
-
97
-
98
-
99
-
100
-
101
-
102
-
103
-
104
-
105
-
106
-
107
-
108
-
109
-
110
-
111
-
112
-
113
-
114
-
115
-
116
-
117
-
118
-
119
-
120
-
121
-
122
-
123
-
124
-
125
-
126
-
127
-
128
-
129
-
130
-
131
-
132
-
133
-
134
-
135
-
136
-
137
-
138
-
139
-
140
-
141
-
142
-
143
-
144
-
145
-
146
-
147
-
148
-
149
-
150
-
151
-
152
-
153
-
154
-
155
-
156
-
157
-
158
-
159
-
160
-
161
-
162
-
163
-
164
-
165
-
166
-
167
-
168
-
169
-
170
-
171
-
172
-
173
-
174
-
175
-
176
-
177
-
178
-
 179
179 -
 180
180 -
 181
181 -
 182
182 -
 183
183 -
 184
184 -
 185
185 -
 186
186 -
 187
187 -
 188
188 -
 189
189 -
 190
190 -
 191
191 -
 192
192 -
 193
193 -
 194
194 -
 195
195 -
 196
196 -
 197
197 -
 198
198 -
 199
199 -
200
-
201
-
202
-
203
-
204
-
205
-
206
-
207
-
208
-
209
-
210
-
211
-
212
-
213
-
214
-
215
-
216
-
217
-
218
-
219
-
220
-
221
-
222
-
223
-
224
-
225
-
226
-
227
-
228
-
229
-
230
-
231
-
232
-
233
-
234
-
235
-
236
-
237
-
238
-
239
-
240
-
241
-
242
-
243
-
244
-
245
-
246
-
247
-
248
-
249
-
250
-
251
-
252
-
253
-
254
 |
 |

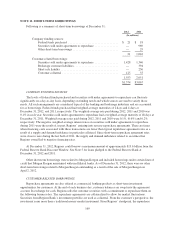
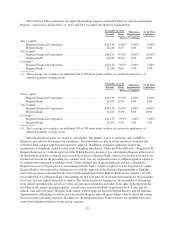
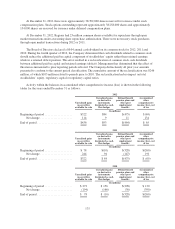
The following tables summarize the applicable holding company and bank regulatory capital requirements.
Regions’ capital ratios at December 31, 2012 and 2011 exceeded all regulatory requirements.
December 31, 2012 Minimum
Requirement
To Be Well
CapitalizedAmount Ratio
(Dollars in millions)
Tier 1 capital:
Regions Financial Corporation .......................... $11,134 12.00% 4.00% 6.00%
Regions Bank ........................................ 12,246 13.25 4.00 6.00
Total capital:
Regions Financial Corporation .......................... $14,272 15.38% 8.00% 10.00%
Regions Bank ........................................ 14,818 16.04 8.00 10.00
Leverage(1) :
Regions Financial Corporation .......................... $11,134 9.65% 3.00% 5.00%
Regions Bank ........................................ 12,246 10.65 3.00 5.00
(1) The Leverage ratio requires an additional 100 to 200 basis-point cushion, in certain circumstances, of
adjusted quarterly average assets.
December 31, 2011 Minimum
Requirement
To Be Well
CapitalizedAmount Ratio
(Dollars in millions)
Tier 1 capital:
Regions Financial Corporation .......................... $12,139 13.28% 4.00% 6.00%
Regions Bank ........................................ 11,623 12.86 4.00 6.00
Total capital:
Regions Financial Corporation .......................... $15,538 16.99% 8.00% 10.00%
Regions Bank ........................................ 14,447 15.98 8.00 10.00
Leverage(1) :
Regions Financial Corporation .......................... $12,139 9.91% 3.00% 5.00%
Regions Bank ........................................ 11,623 9.76 3.00 5.00
(1) The Leverage ratio requires an additional 100 to 200 basis-point cushion, in certain circumstances, of
adjusted quarterly average assets.
Substantially all net assets are owned by subsidiaries. The primary source of operating cash available to
Regions is provided by dividends from subsidiaries. Statutory limits are placed on the amount of dividends the
subsidiary bank can pay without prior regulatory approval. In addition, regulatory authorities require the
maintenance of minimum capital-to-asset ratios at banking subsidiaries. Under the Federal Reserve’s Regulation H,
Regions Bank may not, without approval of the Federal Reserve, declare or pay a dividend to Regions if the total of
all dividends declared in a calendar year exceeds the total of (a) Regions Bank’s net income for that year and (b) its
retained net income for the preceding two calendar years, less any required transfers to additional paid-in capital or
to a fund for the retirement of preferred stock. Under Alabama law, Regions Bank may not pay a dividend to
Regions in excess of 90 percent of its net earnings until the bank’s surplus is equal to at least 20 percent of capital.
Regions Bank is also required by Alabama law to seek the approval of the Alabama Superintendent of Banking
prior to the payment of dividends if the total of all dividends declared by Regions Bank in any calendar year will
exceed the total of (a) Regions Bank’s net earnings for that year, plus (b) its retained net earnings for the preceding
two years, less any required transfers to surplus. The statute defines net earnings as “the remainder of all earnings
from current operations plus actual recoveries on loans and investments and other assets, after deducting from the
total thereof all current operating expenses, actual losses, accrued dividends on preferred stock, if any, and all
federal, state and local taxes.” Regions Bank cannot, without approval from the Federal Reserve and the Alabama
Superintendent of Banking, declare or pay a dividend to Regions unless Regions Bank is able to satisfy the criteria
discussed in the preceding sentences. In addition to dividend restrictions, Federal statutes also prohibit unsecured
loans from banking subsidiaries to the parent company.
173