Regions Bank 2012 Annual Report Download - page 88
Download and view the complete annual report
Please find page 88 of the 2012 Regions Bank annual report below. You can navigate through the pages in the report by either clicking on the pages listed below, or by using the keyword search tool below to find specific information within the annual report.-
 1
1 -
2
-
3
-
4
-
5
-
6
-
7
-
8
-
9
-
10
-
11
-
12
-
13
-
14
-
15
-
16
-
17
-
18
-
19
-
20
-
21
-
22
-
23
-
24
-
25
-
26
-
27
-
28
-
29
-
30
-
31
-
32
-
33
-
34
-
35
-
36
-
37
-
38
-
39
-
40
-
41
-
42
-
43
-
44
-
45
-
46
-
47
-
48
-
49
-
50
-
51
-
52
-
53
-
54
-
55
-
56
-
57
-
58
-
59
-
60
-
61
-
62
-
63
-
64
-
65
-
66
-
67
-
68
-
69
-
70
-
71
-
72
-
73
-
74
-
75
-
76
-
77
-
 78
78 -
 79
79 -
 80
80 -
 81
81 -
 82
82 -
 83
83 -
 84
84 -
 85
85 -
 86
86 -
 87
87 -
 88
88 -
 89
89 -
 90
90 -
 91
91 -
 92
92 -
 93
93 -
 94
94 -
 95
95 -
 96
96 -
 97
97 -
 98
98 -
99
-
100
-
101
-
102
-
103
-
104
-
105
-
106
-
107
-
108
-
109
-
110
-
111
-
112
-
113
-
114
-
115
-
116
-
117
-
118
-
119
-
120
-
121
-
122
-
123
-
124
-
125
-
126
-
127
-
128
-
129
-
130
-
131
-
132
-
133
-
134
-
135
-
136
-
137
-
138
-
139
-
140
-
141
-
142
-
143
-
144
-
145
-
146
-
147
-
148
-
149
-
150
-
151
-
152
-
153
-
154
-
155
-
156
-
157
-
158
-
159
-
160
-
161
-
162
-
163
-
164
-
165
-
166
-
167
-
168
-
169
-
170
-
171
-
172
-
173
-
174
-
175
-
176
-
177
-
178
-
179
-
180
-
181
-
182
-
183
-
184
-
185
-
186
-
187
-
188
-
189
-
190
-
191
-
192
-
193
-
194
-
195
-
196
-
197
-
198
-
199
-
200
-
201
-
202
-
203
-
204
-
205
-
206
-
207
-
208
-
209
-
210
-
211
-
212
-
213
-
214
-
215
-
216
-
217
-
218
-
219
-
220
-
221
-
222
-
223
-
224
-
225
-
226
-
227
-
228
-
229
-
230
-
231
-
232
-
233
-
234
-
235
-
236
-
237
-
238
-
239
-
240
-
241
-
242
-
243
-
244
-
245
-
246
-
247
-
248
-
249
-
250
-
251
-
252
-
253
-
254
 |
 |
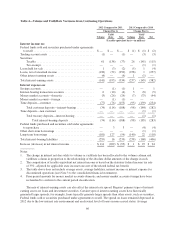
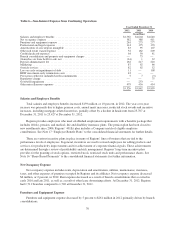
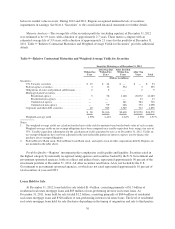
agencies’ ratings, comprised of Regions Bank’s capital, asset quality, management, earnings, liquidity and
sensitivity to risk, along with certain financial ratios are used in determining deposit administrative fees. The
decrease in 2012 was related to lower asset balances, including a reduction in higher risk loans and improved
performance metrics, including asset quality metrics, all of which impact the fee calculation. For further
information, see discussion of Deposit Insurance in the Supervision and Regulation section of Item 1 of this
Form 10-K.
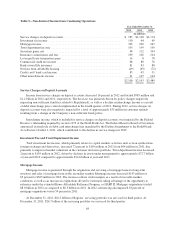
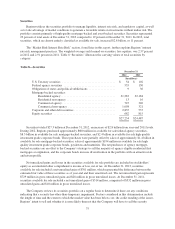
Marketing
Marketing increased $25 million in 2012 compared to 2011, primarily due to costs incurred for customer
communications in conjunction with Regions’ third quarter 2012 assumption of the servicing of the credit card
portfolio which had been purchased in the second quarter of 2011.
Outside Services
Outside services increased in 2012 by $20 million to $82 million. The increase was due primarily to
expenses incurred related to assuming the servicing of the credit card portfolio during the third quarter of 2012
that was purchased at the end of the second quarter of 2011, as well as fees related to the routine purchases of
indirect loans from a third party.
Loss on Early Extinguishment of Debt
During the fourth quarter of 2012, the Company redeemed all issued and outstanding 8.875% Trust
Preferred Securities issued by Regions Financing Trust III (“trust preferred securities”). The aggregate principal
amount of the trust preferred securities was approximately $345 million. The Company recognized an
$11 million loss on the early redemption of these securities.
REIT Investment Early Termination Costs
On November 30, 2012, Regions entered into an agreement with a third party investor in Regions Asset
Management Company, Inc., a real estate investment trust, pursuant to which the investment was fully redeemed.
As a result, Regions incurred early termination costs of approximately $42 million.
Goodwill Impairment
As a result of the process of selling Morgan Keegan, Regions’ 2011 results include a non-cash goodwill
impairment charge of $731 million (net of $14 million income tax impact) within the investment banking/
brokerage/trust segment. Based on a relative fair value allocation, $478 million was recorded within discontinued
operations and $253 million within continuing operations. The goodwill impairment charge is a non-cash item
which does not have an adverse impact on regulatory capital. Refer to Note 9 “Intangible Assets” in the footnotes
to the consolidated financial statements for further details.
Other Miscellaneous Expenses
Other miscellaneous expenses increased $43 million in 2012 compared to 2011. The primary drivers of the
increase were mortgage repurchase expenses (see Note 7 “Servicing of Financial Assets”), amortization of
intangible assets related to the credit card portfolio purchase and bank operational losses. This item also includes
expenses for communications, postage, supplies, certain credit-related costs and business development services.
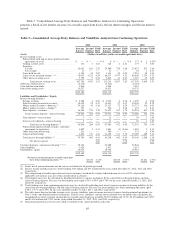
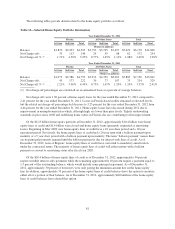
INCOME TAXES
The Company’s income tax expense from continuing operations for 2012 was $482 million compared to a
tax benefit of $28 million in 2011, resulting in an effective tax rate of 29.0 percent and (17.4) percent,
respectively. The increase in income tax expense was primarily a result of positive consolidated pre-tax earnings.
72