Regions Bank 2012 Annual Report Download - page 194
Download and view the complete annual report
Please find page 194 of the 2012 Regions Bank annual report below. You can navigate through the pages in the report by either clicking on the pages listed below, or by using the keyword search tool below to find specific information within the annual report.-
 1
1 -
2
-
3
-
4
-
5
-
6
-
7
-
8
-
9
-
10
-
11
-
12
-
13
-
14
-
15
-
16
-
17
-
18
-
19
-
20
-
21
-
22
-
23
-
24
-
25
-
26
-
27
-
28
-
29
-
30
-
31
-
32
-
33
-
34
-
35
-
36
-
37
-
38
-
39
-
40
-
41
-
42
-
43
-
44
-
45
-
46
-
47
-
48
-
49
-
50
-
51
-
52
-
53
-
54
-
55
-
56
-
57
-
58
-
59
-
60
-
61
-
62
-
63
-
64
-
65
-
66
-
67
-
68
-
69
-
70
-
71
-
72
-
73
-
74
-
75
-
76
-
77
-
78
-
79
-
80
-
81
-
82
-
83
-
84
-
85
-
86
-
87
-
88
-
89
-
90
-
91
-
92
-
93
-
94
-
95
-
96
-
97
-
98
-
99
-
100
-
101
-
102
-
103
-
104
-
105
-
106
-
107
-
108
-
109
-
110
-
111
-
112
-
113
-
114
-
115
-
116
-
117
-
118
-
119
-
120
-
121
-
122
-
123
-
124
-
125
-
126
-
127
-
128
-
129
-
130
-
131
-
132
-
133
-
134
-
135
-
136
-
137
-
138
-
139
-
140
-
141
-
142
-
143
-
144
-
145
-
146
-
147
-
148
-
149
-
150
-
151
-
152
-
153
-
154
-
155
-
156
-
157
-
158
-
159
-
160
-
161
-
162
-
163
-
164
-
165
-
166
-
167
-
168
-
169
-
170
-
171
-
172
-
173
-
174
-
175
-
176
-
177
-
178
-
179
-
180
-
181
-
182
-
183
-
 184
184 -
 185
185 -
 186
186 -
 187
187 -
 188
188 -
 189
189 -
 190
190 -
 191
191 -
 192
192 -
 193
193 -
 194
194 -
 195
195 -
 196
196 -
 197
197 -
 198
198 -
 199
199 -
 200
200 -
 201
201 -
 202
202 -
 203
203 -
 204
204 -
205
-
206
-
207
-
208
-
209
-
210
-
211
-
212
-
213
-
214
-
215
-
216
-
217
-
218
-
219
-
220
-
221
-
222
-
223
-
224
-
225
-
226
-
227
-
228
-
229
-
230
-
231
-
232
-
233
-
234
-
235
-
236
-
237
-
238
-
239
-
240
-
241
-
242
-
243
-
244
-
245
-
246
-
247
-
248
-
249
-
250
-
251
-
252
-
253
-
254
 |
 |

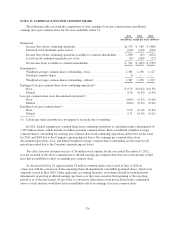
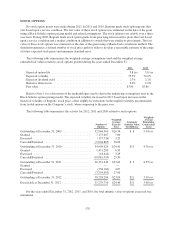
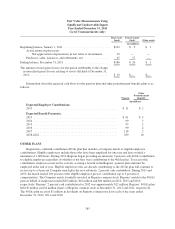
STOCK OPTIONS
No stock option grants were made during 2012. In 2011 and 2010, Regions made stock option grants that
vest based upon a service condition. The fair value of these stock options was estimated on the date of the grant
using a Black-Scholes option pricing model and related assumptions. The stock options vest ratably over a three-
year term. During 2009, Regions made stock option grants from prior long-term incentive plans that vest based
upon a service condition and a market condition in addition to awards that were similar to prior grants. The fair
value of these stock options was estimated on the date of the grant using a Monte-Carlo simulation method. The
simulation generates a defined number of stock price paths in order to develop a reasonable estimate of the range
of future expected stock prices and minimize standard error.
The following table summarizes the weighted-average assumptions used and the weighted-average
estimated fair values related to stock options granted during the years ended December 31:
2011 2010
Expected option life ................................................ 5.8yrs. 5.8 yrs.
Expected volatility .................................................. 75.5% 74.0%
Expected dividend yield ............................................. 2.3% 2.2%
Risk-free interest rate ............................................... 2.0% 2.2%
Fair value ......................................................... $3.66 $3.86
Refer to Note 1 for a discussion of the methodologies used to derive the underlying assumptions used in the
Black-Scholes option pricing model. The expected volatility increased in 2011 based upon increases in the
historical volatility of Regions’ stock price, offset slightly by reductions in the implied volatility measurements
from traded options on the Company’s stock, when comparing to the prior year.
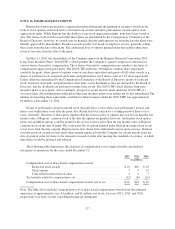
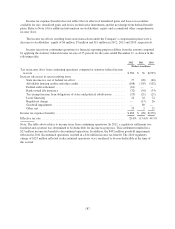
The following table summarizes the activity for 2012, 2011 and 2010 related to stock options:
Number of
Options
Weighted-
Average
Exercise
Price
Aggregate
Intrinsic Value
(In Millions)
Weighted-
Average
Remaining
Contractual
Term
Outstanding at December 31, 2009 ................... 52,968,560 $26.34 $ 8 5.04 yrs.
Granted ......................................... 7,173,667 7.00
Exercised ........................................ (137,736) 3.29
Canceled/Forfeited ................................ (5,004,865) 20.66
Outstanding at December 31, 2010 ................... 54,999,626 $24.41 $11 4.76 yrs.
Granted ......................................... 1,451,200 6.59
Exercised ........................................ (18,442) 3.29
Canceled/Forfeited ................................ (10,081,035) 25.30
Outstanding at December 31, 2011 ................... 46,351,349 $23.62 $ 3 4.55 yrs.
Granted ......................................... — —
Exercised ........................................ (338,182) 4.07
Canceled/Forfeited ................................ (7,754,963) 27.06
Outstanding at December 31, 2012 ................... 38,258,204 $23.09 $11 3.99 yrs.
Exercisable at December 31, 2012 .................... 35,279,710 $24.46 $11 3.68 yrs.
For the years ended December 31, 2012, 2011, and 2010, the total intrinsic value of options exercised was
immaterial.
178