Regions Bank 2012 Annual Report Download - page 169
Download and view the complete annual report
Please find page 169 of the 2012 Regions Bank annual report below. You can navigate through the pages in the report by either clicking on the pages listed below, or by using the keyword search tool below to find specific information within the annual report.-
 1
1 -
2
-
3
-
4
-
5
-
6
-
7
-
8
-
9
-
10
-
11
-
12
-
13
-
14
-
15
-
16
-
17
-
18
-
19
-
20
-
21
-
22
-
23
-
24
-
25
-
26
-
27
-
28
-
29
-
30
-
31
-
32
-
33
-
34
-
35
-
36
-
37
-
38
-
39
-
40
-
41
-
42
-
43
-
44
-
45
-
46
-
47
-
48
-
49
-
50
-
51
-
52
-
53
-
54
-
55
-
56
-
57
-
58
-
59
-
60
-
61
-
62
-
63
-
64
-
65
-
66
-
67
-
68
-
69
-
70
-
71
-
72
-
73
-
74
-
75
-
76
-
77
-
78
-
79
-
80
-
81
-
82
-
83
-
84
-
85
-
86
-
87
-
88
-
89
-
90
-
91
-
92
-
93
-
94
-
95
-
96
-
97
-
98
-
99
-
100
-
101
-
102
-
103
-
104
-
105
-
106
-
107
-
108
-
109
-
110
-
111
-
112
-
113
-
114
-
115
-
116
-
117
-
118
-
119
-
120
-
121
-
122
-
123
-
124
-
125
-
126
-
127
-
128
-
129
-
130
-
131
-
132
-
133
-
134
-
135
-
136
-
137
-
138
-
139
-
140
-
141
-
142
-
143
-
144
-
145
-
146
-
147
-
148
-
149
-
150
-
151
-
152
-
153
-
154
-
155
-
156
-
157
-
158
-
 159
159 -
 160
160 -
 161
161 -
 162
162 -
 163
163 -
 164
164 -
 165
165 -
 166
166 -
 167
167 -
 168
168 -
 169
169 -
 170
170 -
 171
171 -
 172
172 -
 173
173 -
 174
174 -
 175
175 -
 176
176 -
 177
177 -
 178
178 -
 179
179 -
180
-
181
-
182
-
183
-
184
-
185
-
186
-
187
-
188
-
189
-
190
-
191
-
192
-
193
-
194
-
195
-
196
-
197
-
198
-
199
-
200
-
201
-
202
-
203
-
204
-
205
-
206
-
207
-
208
-
209
-
210
-
211
-
212
-
213
-
214
-
215
-
216
-
217
-
218
-
219
-
220
-
221
-
222
-
223
-
224
-
225
-
226
-
227
-
228
-
229
-
230
-
231
-
232
-
233
-
234
-
235
-
236
-
237
-
238
-
239
-
240
-
241
-
242
-
243
-
244
-
245
-
246
-
247
-
248
-
249
-
250
-
251
-
252
-
253
-
254
 |
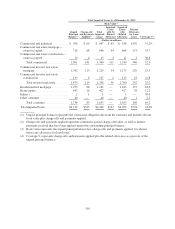
 |

2011
Commercial
Investor Real
Estate Consumer Total
(In millions)
Allowance for loan losses, January 1, 2011 ................... $ 1,055 $ 1,370 $ 760 $ 3,185
Provision for loan losses .................................. 475 468 587 1,530
Loan losses:
Charge-offs ........................................ (550) (880) (677) (2,107)
Recoveries ........................................ 50 33 54 137
Net loan losses ..................................... (500) (847) (623) (1,970)
Allowance for loan losses, December 31, 2011 ................ 1,030 991 724 2,745
Reserve for unfunded credit commitments, January 1, 2011 ...... 32 16 23 71
Provision (credit) for unfunded credit commitments ........ (2) 10 (1) 7
Reserve for unfunded credit commitments, December 31, 2011 . . . 30 26 22 78
Allowance for credit losses, December 31, 2011 ............... $ 1,060 $ 1,017 $ 746 $ 2,823
Portion of ending allowance for loan losses:
Individually evaluated for impairment ................... $ 101 $ 169 $ 1 $ 271
Collectively evaluated for impairment ................... 929 822 723 2,474
Total allowance for loan losses ............................ $ 1,030 $ 991 $ 724 $ 2,745
Portion of loan portfolio ending balance:
Individually evaluated for impairment ................... $ 473 $ 624 $ 7 $ 1,104
Collectively evaluated for impairment ................... 35,552 10,103 30,835 76,490
Total loans evaluated for impairment ........................ $36,025 $10,727 $30,842 $77,594
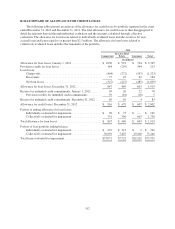
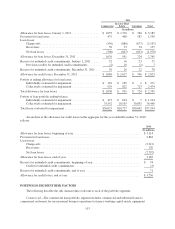
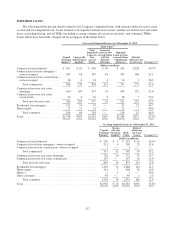
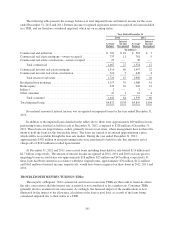
An analysis of the allowance for credit losses in the aggregate for the year ended December 31, 2010
follows:
2010
(In millions)
Allowance for loan losses, beginning of year ............................................ $3,114
Provision for loan losses ............................................................. 2,863
Loan losses:
Charge-offs ................................................................... (2,912)
Recoveries ................................................................... 120
Net loan losses ................................................................ (2,792)
Allowance for loan losses, end of year .................................................. 3,185
Reserve for unfunded credit commitments, beginning of year ............................... $ 74
Credit for unfunded credit commitments ............................................ (3)
Reserve for unfunded credit commitments, end of year .................................... 71
Allowance for credit losses, end of year ................................................ $3,256
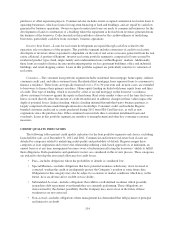
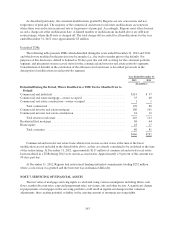
PORTFOLIO SEGMENT RISK FACTORS
The following describe the risk characteristics relevant to each of the portfolio segments.
Commercial—The commercial loan portfolio segment includes commercial and industrial loans to
commercial customers for use in normal business operations to finance working capital needs, equipment
153