Regions Bank 2012 Annual Report Download - page 66
Download and view the complete annual report
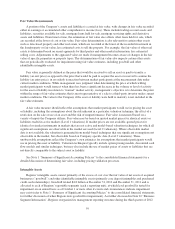
Please find page 66 of the 2012 Regions Bank annual report below. You can navigate through the pages in the report by either clicking on the pages listed below, or by using the keyword search tool below to find specific information within the annual report.-
 1
1 -
2
-
3
-
4
-
5
-
6
-
7
-
8
-
9
-
10
-
11
-
12
-
13
-
14
-
15
-
16
-
17
-
18
-
19
-
20
-
21
-
22
-
23
-
24
-
25
-
26
-
27
-
28
-
29
-
30
-
31
-
32
-
33
-
34
-
35
-
36
-
37
-
38
-
39
-
40
-
41
-
42
-
43
-
44
-
45
-
46
-
47
-
48
-
49
-
50
-
51
-
52
-
53
-
54
-
55
-
 56
56 -
 57
57 -
 58
58 -
 59
59 -
 60
60 -
 61
61 -
 62
62 -
 63
63 -
 64
64 -
 65
65 -
 66
66 -
 67
67 -
 68
68 -
 69
69 -
 70
70 -
 71
71 -
 72
72 -
 73
73 -
 74
74 -
 75
75 -
 76
76 -
77
-
78
-
79
-
80
-
81
-
82
-
83
-
84
-
85
-
86
-
87
-
88
-
89
-
90
-
91
-
92
-
93
-
94
-
95
-
96
-
97
-
98
-
99
-
100
-
101
-
102
-
103
-
104
-
105
-
106
-
107
-
108
-
109
-
110
-
111
-
112
-
113
-
114
-
115
-
116
-
117
-
118
-
119
-
120
-
121
-
122
-
123
-
124
-
125
-
126
-
127
-
128
-
129
-
130
-
131
-
132
-
133
-
134
-
135
-
136
-
137
-
138
-
139
-
140
-
141
-
142
-
143
-
144
-
145
-
146
-
147
-
148
-
149
-
150
-
151
-
152
-
153
-
154
-
155
-
156
-
157
-
158
-
159
-
160
-
161
-
162
-
163
-
164
-
165
-
166
-
167
-
168
-
169
-
170
-
171
-
172
-
173
-
174
-
175
-
176
-
177
-
178
-
179
-
180
-
181
-
182
-
183
-
184
-
185
-
186
-
187
-
188
-
189
-
190
-
191
-
192
-
193
-
194
-
195
-
196
-
197
-
198
-
199
-
200
-
201
-
202
-
203
-
204
-
205
-
206
-
207
-
208
-
209
-
210
-
211
-
212
-
213
-
214
-
215
-
216
-
217
-
218
-
219
-
220
-
221
-
222
-
223
-
224
-
225
-
226
-
227
-
228
-
229
-
230
-
231
-
232
-
233
-
234
-
235
-
236
-
237
-
238
-
239
-
240
-
241
-
242
-
243
-
244
-
245
-
246
-
247
-
248
-
249
-
250
-
251
-
252
-
253
-
254
 |
 |

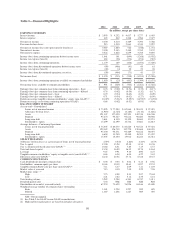
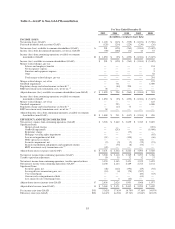
Table 1—Financial Highlights
2012 2011 2010 2009 2008
(In millions, except per share data)
EARNINGS SUMMARY
Interest income ................................................... $ 3,903 $ 4,252 $ 4,637 $ 5,277 $ 6,465
Interest expense ................................................... 603 842 1,248 1,984 2,677
Net interest income ................................................ 3,300 3,410 3,389 3,293 3,788
Provision for loan losses ............................................ 213 1,530 2,863 3,541 2,057
Net interest income (loss) after provision for loan losses ................... 3,087 1,880 526 (248) 1,731
Non-interest income ............................................... 2,100 2,143 2,489 2,765 2,132
Non-interest expense ............................................... 3,526 3,862 3,859 3,785 9,895
Income (loss) from continuing operations before income taxes .............. 1,661 161 (844) (1,268) (6,032)
Income tax expense (benefit) ........................................ 482 (28) (376) (194) (383)
Income (loss) from continuing operations .............................. 1,179 189 (468) (1,074) (5,649)
Income (loss) from discontinued operations before income taxes ............ (99) (408) (41) 66 81
Income tax expense (benefit) ........................................ (40) (4) 30 23 28
Income (loss) from discontinued operations, net of tax .................... (59) (404) (71) 43 53
Net income (loss) ................................................. $ 1,120 $ (215) $ (539) $ (1,031) $ (5,596)
Income (loss) from continuing operations available to common shareholders . . . $ 1,050 $ (25) $ (692) $ (1,304) $ (5,675)
Net income (loss) available to common shareholders ..................... $ 991 $ (429) $ (763) $ (1,261) $ (5,622)
Earnings (loss) per common share from continuing operations – basic ........ $ 0.76 $ (0.02) $ (0.56) $ (1.32) $ (8.17)
Earnings (loss) per common share from continuing operations – diluted ...... 0.76 (0.02) (0.56) (1.32) (8.17)
Earnings (loss) per common share – basic .............................. 0.72 (0.34) (0.62) (1.27) (8.09)
Earnings (loss) per common share – diluted ............................. 0.71 (0.34) (0.62) (1.27) (8.09)
Return on average tangible common stockholders’ equity (non-GAAP) (1) ..... 10.69% (5.51)% (9.29)% (14.92)% (71.29)%
Return on average assets from continuing operations (GAAP) .............. 0.86 (0.02) (0.52) (0.93) (4.04)
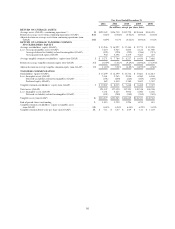
BALANCE SHEET SUMMARY
At year-end—Consolidated .........................................
Loans, net of unearned income ................................... $ 73,995 $ 77,594 $ 82,864 $ 90,674 $ 97,419
Allowance for loan losses ....................................... (1,919) (2,745) (3,185) (3,114) (1,826)
Assets ...................................................... 121,347 127,050 132,351 142,318 146,248
Deposits..................................................... 95,474 95,627 94,614 98,680 90,904
Long-term debt ............................................... 5,861 8,110 13,190 18,464 19,231
Stockholders’ equity ........................................... 15,499 16,499 16,734 17,881 16,813
Average balances—Continuing Operations .............................
Loans, net of unearned income ................................... $ 76,035 $ 80,673 $ 86,660 $ 94,523 $ 97,601
Assets ...................................................... 122,182 126,719 132,720 139,468 140,455
Deposits..................................................... 95,330 95,671 96,489 94,612 90,077
Long-term debt ............................................... 6,694 11,240 15,489 18,501 13,422
Stockholders’ equity ........................................... 15,035 15,350 15,916 16,224 18,514
SELECTED RATIOS
Allowance for loan losses as a percentage of loans, net of unearned income . . . 2.59% 3.54% 3.84% 3.43% 1.87%
Tier 1 capital ..................................................... 12.00 13.28 12.40 11.54 10.38
Tier 1 common risk-based ratio (non-GAAP) (1) ......................... 10.84 8.51 7.85 7.15 6.57
Total risk-based capital ............................................. 15.38 16.99 16.35 15.78 14.64
Leverage ........................................................ 9.65 9.91 9.30 8.90 8.47
Tangible common stockholders’ equity to tangible assets (non-GAAP) (1) ..... 8.63 6.58 6.04 6.22 5.43
Efficiency ratio (non-GAAP) (1) ...................................... 64.42 64.56 67.74 67.88 60.67
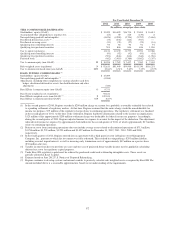
COMMON STOCK DATA
Cash dividends declared per common share ............................. $ 0.04 $ 0.04 $ 0.04 $ 0.13 $ 0.96
Stockholders’ common equity per share ................................ 10.63 10.39 10.63 11.97 19.53
Tangible common book value per share (non-GAAP) (1) ................... 7.11 6.37 6.09 7.11 11.03
Market value at year-end ........................................... 7.13 4.30 7.00 5.29 7.96
Market price range: (2)
High........................................................ 7.73 8.09 9.33 9.07 25.84
Low ........................................................ 4.21 2.82 5.12 2.35 6.41
Total trading volume ............................................... 5,282 5,204 6,381 8,747 3,411
Dividend payout ratio .............................................. 5.63 NM NM NM NM
Shareholders of record at year-end (actual) ............................. 67,574 73,659 76,996 81,166 83,600
Weighted-average number of common shares outstanding
Basic ....................................................... 1,381 1,258 1,227 989 695
Diluted...................................................... 1,387 1,258 1,227 989 695
NM—Not meaningful
(1) See Table 2 for GAAP to non-GAAP reconciliations.
(2) High and low market prices are based on intraday sales prices.
50