Regions Bank 2012 Annual Report Download - page 109
Download and view the complete annual report
Please find page 109 of the 2012 Regions Bank annual report below. You can navigate through the pages in the report by either clicking on the pages listed below, or by using the keyword search tool below to find specific information within the annual report.-
 1
1 -
2
-
3
-
4
-
5
-
6
-
7
-
8
-
9
-
10
-
11
-
12
-
13
-
14
-
15
-
16
-
17
-
18
-
19
-
20
-
21
-
22
-
23
-
24
-
25
-
26
-
27
-
28
-
29
-
30
-
31
-
32
-
33
-
34
-
35
-
36
-
37
-
38
-
39
-
40
-
41
-
42
-
43
-
44
-
45
-
46
-
47
-
48
-
49
-
50
-
51
-
52
-
53
-
54
-
55
-
56
-
57
-
58
-
59
-
60
-
61
-
62
-
63
-
64
-
65
-
66
-
67
-
68
-
69
-
70
-
71
-
72
-
73
-
74
-
75
-
76
-
77
-
78
-
79
-
80
-
81
-
82
-
83
-
84
-
85
-
86
-
87
-
88
-
89
-
90
-
91
-
92
-
93
-
94
-
95
-
96
-
97
-
98
-
 99
99 -
 100
100 -
 101
101 -
 102
102 -
 103
103 -
 104
104 -
 105
105 -
 106
106 -
 107
107 -
 108
108 -
 109
109 -
 110
110 -
 111
111 -
 112
112 -
 113
113 -
 114
114 -
 115
115 -
 116
116 -
 117
117 -
 118
118 -
 119
119 -
120
-
121
-
122
-
123
-
124
-
125
-
126
-
127
-
128
-
129
-
130
-
131
-
132
-
133
-
134
-
135
-
136
-
137
-
138
-
139
-
140
-
141
-
142
-
143
-
144
-
145
-
146
-
147
-
148
-
149
-
150
-
151
-
152
-
153
-
154
-
155
-
156
-
157
-
158
-
159
-
160
-
161
-
162
-
163
-
164
-
165
-
166
-
167
-
168
-
169
-
170
-
171
-
172
-
173
-
174
-
175
-
176
-
177
-
178
-
179
-
180
-
181
-
182
-
183
-
184
-
185
-
186
-
187
-
188
-
189
-
190
-
191
-
192
-
193
-
194
-
195
-
196
-
197
-
198
-
199
-
200
-
201
-
202
-
203
-
204
-
205
-
206
-
207
-
208
-
209
-
210
-
211
-
212
-
213
-
214
-
215
-
216
-
217
-
218
-
219
-
220
-
221
-
222
-
223
-
224
-
225
-
226
-
227
-
228
-
229
-
230
-
231
-
232
-
233
-
234
-
235
-
236
-
237
-
238
-
239
-
240
-
241
-
242
-
243
-
244
-
245
-
246
-
247
-
248
-
249
-
250
-
251
-
252
-
253
-
254
 |
 |

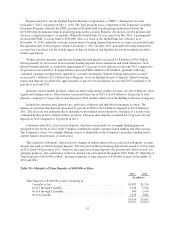
Regions elected to exit the Federal Deposit Insurance Corporation’s (“FDIC”) Transaction Account
Guarantee (“TAG”) program on July 1, 2010. The TAG program was a component of the Temporary Liquidity
Guarantee Program, whereby the FDIC guaranteed all funds held at participating institutions beyond the
$250,000 deposit insurance limit in qualifying transaction accounts. Regions’ decision to exit the program did
not have a significant impact on liquidity. When the Dodd-Frank Act was enacted in July 2010, it permanently
increased the FDIC coverage limit to $250,000. Also as a result of the Dodd-Frank Act, effective as of
December 31, 2010, unlimited coverage for non-interest bearing demand transaction accounts was provided until
the expiration date of the program, which was January 1, 2013. In early 2013, non-interest bearing transaction
accounts have declined, but the overall impact to deposit balances and liquidity has not been significant and is
within expectations.
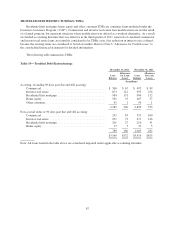
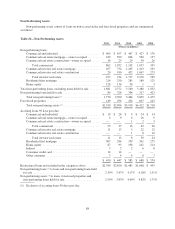
Within customer deposits, non-interest-bearing demand deposits increased $1.8 billion to $30.0 billion,
driven primarily by an increase in non-interest bearing deposits from commercial and small businesses. Non-
interest-bearing deposits accounted for approximately 31 percent of total deposits at year-end 2012 compared to
29 percent at year-end 2011. Savings balances increased $601 million to $5.8 billion, generally reflecting
continued consumer savings trends, spurred by economic uncertainty. Interest-bearing transaction accounts
increased $1.7 billion to $21.1 billion due to Regions’ focus on shifting the mix of deposits. Interest-bearing
transaction deposits accounted for approximately 22 percent of total deposits at year-end 2012 compared to 20
percent at year-end 2011.
Domestic money market products, which exclude foreign money market accounts, are one of Regions’ most
significant funding sources. These balances increased 8 percent in 2012 to $24.9 billion or 26 percent of total
deposits, compared to 24 percent of total deposits in 2011 another reflection of the shifting in the mix of deposits.
Included in customer time deposits are certificates of deposit and individual retirement accounts. The
balance of customer time deposits decreased 31 percent in 2012 to $13.4 billion compared to $19.4 billion in
2011. The decrease was primarily due to maturities with minimal reinvestment by customers as a result of the
continued decline in rates offered on these products. Customer time deposits accounted for 14 percent of total
deposits in 2012 compared to 20 percent in 2011.
Consistent with 2011, total treasury deposits, which are used mainly for overnight funding purposes,
remained at low levels in 2012 as the Company continued to utilize customer-based funding and other sources.
The Company’s choice of overnight funding sources is dependent on the Company’s particular funding needs
and the relative attractiveness of each source.
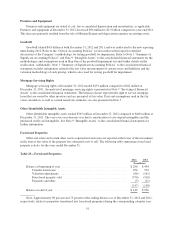
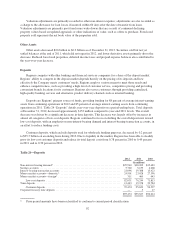
The sensitivity of Regions’ deposit rates to changes in market interest rates is reflected in Regions’ average
interest rate paid on interest-bearing deposits. The rate paid on interest-bearing deposits decreased to 0.43 percent
in 2012 from 0.69 percent in 2011, driven by the expiration of time deposits, the positive mix shift to lower cost
customer products, and continuation of the low interest rate environment throughout 2012. Table 25 “Maturity of
Time Deposits of $100,000 or More” presents maturities of time deposits of $100,000 or more at December 31,
2012 and 2011.
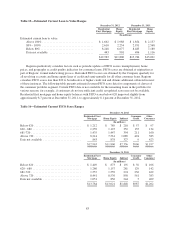
Table 25—Maturity of Time Deposits of $100,000 or More
2012 2011
(In millions)
Time deposits of $100,000 or more, maturing in:
3 months or less ................................................. $1,002 $1,216
Over 3 through 6 months .......................................... 1,168 1,504
Over 6 through 12 months ......................................... 900 1,910
Over 12 months ................................................. 1,949 3,061
$5,019 $7,691
93